
Fractals in Forex and How to Use Them in Trading
If you can identify the exact turning points of price on the chart, you will achieve more optimal entries, set more logical stop loss levels, and simplify your trade management. This is exactly what fractals provide for you. Despite their simple appearance, fractals are among the most profound concepts based on mathematics, chaos theory, and the repeatability of market behavior, helping traders identify hidden patterns within seemingly random price fluctuations. In this article, we examine fractals in Forex from the basics to the professional level from their definition and structure to how they are plotted on the chart, trading strategies, combinations with various indicators, and entry checklists. If you are looking to enhance the accuracy of your analysis and decision making, understanding fractals is one of the most important parts of your journey.
Fractals in Forex and How to Use Them in Trading
In technical analysis , a fractal is a pattern that indicates significant changes in price trends. This pattern typically consists of five consecutive candlesticks, with one particular candlestick serving as the highest or lowest point of price movement. Fractals play a crucial role in identifying potential market reversal points and can help traders recognize possible support and resistance levels.
Fractals are recurring patterns that appear in price charts and function based on mathematical principles and chaos theory. Many analysts use this concept to understand the more complex structures of the market. Additionally, fractals are applied in other analytical methods such as Elliott Wave Theory and price action analysis.
Why Do Forex Traders Use Fractals?
Fractals are widely used in technical analysis because they help traders identify turning points in the market. One of the primary reasons traders rely on fractals is their ability to reveal recurring patterns in price charts, aiding in better decision making regarding trade entry and exit points.
Another advantage of using fractals is their simplicity in identification. Unlike some complex indicators, fractals can be easily spotted by observing the price chart. However, traders rarely use them in isolation. Instead, they often combine fractals with other technical analysis tools to strengthen their signals and improve trade accuracy.
Definition of Fractals in Mathematics and Nature
A fractal is a structure characterized by self similarity, meaning each part of it closely resembles the entire structure. Many examples of fractals can be found in nature, such as tree branches, snowflake formations, and coastlines. These structures appear in different scales with a repeating pattern.
The concept of fractals in mathematics was introduced by Benoit Mandelbrot and is recognized as part of non Euclidean geometry. This theory suggests that seemingly chaotic and irregular patterns often contain underlying structures that can be analyzed and understood.
What Do Fractals Mean in Financial Markets?
In financial markets , fractals refer to recurring patterns that appear in price movements. Many traders use these patterns to predict future market movements. The fractal theory in financial markets suggests that price fluctuations are not entirely random but follow specific structural patterns that, when properly analyzed, can help identify trading opportunities.
Fractals in technical analysis are typically used to identify trend reversal points. These patterns help traders recognize potential turning points and adjust their trading strategies accordingly.
The Relationship Between Fractals and Chaos Theory in Financial Markets
Chaos theory suggests that complex systems, such as financial markets, contain identifiable patterns within seemingly random behavior. As a component of this theory, fractals help traders detect repetitive patterns that emerge in the market over time.
This theory also emphasizes that markets move under the influence of psychological forces, and these behavioral patterns repeat in specific cycles. By identifying these cycles through fractals, traders can gain a deeper understanding of market trends and movements.
Types of Fractals in Forex
Fractals in Forex are recurring patterns that form within candlestick structures and indicate potential price reversal points.
These patterns appear simple on the surface, but with proper analysis they can provide deep insights into market behavior. The different types of fractals each convey a distinct message about the battle between buyers and sellers. Correctly understanding these types is the first step toward using fractals intelligently in trading decisions.
Bullish Fractal and Its Characteristics
A bullish fractal is a pattern that indicates a potential price increase. It forms when a candlestick in the middle of five consecutive candles has the lowest price compared to the surrounding candles. This pattern is commonly used as a signal for entering long positions.
One key characteristic of a bullish fractal is that the two candles before and after the middle candlestick must have higher lows. Traders often combine this pattern with other indicators such as trendlines and moving averages to confirm entry signals.
Bearish Fractal and How to Identify It
A bearish fractal signals a potential price decline and forms when the middle candlestick in a sequence of five consecutive candles registers the highest price. This pattern is typically considered a signal to enter a short position.
To confirm a bearish fractal, the two candles before and after the middle candlestick must have lower highs. This pattern is often used in conjunction with tools such as the Relative Strength Index (RSI) or price divergence analysis to improve trade accuracy.
More Complex Fractals and Their Combination with Other Indicators
While basic fractals can provide valuable insights into market reversal points, many traders enhance their performance by integrating these patterns with other technical analysis tools.
A common approach is to combine fractals with moving averages, helping traders refine their entry and exit points. Others use fractals alongside price action strategies to identify key buying and selling zones more effectively.
How to Identify and Plot Fractals on Forex Charts
Identifying and drawing fractals on a Forex chart is a key skill for technical analysts. A fractal structure is typically defined by the formation of five candlesticks, with the middle candlestick determining the peak or trough of the price movement. By closely observing the positioning of these candlesticks, one can identify key reversal points and important supply and demand levels. Many trading platforms offer automatic fractal drawing tools, but learning visual identification significantly increases analytical accuracy and leads to a deeper understanding of price behavior.
Methods for Identifying Fractals Without an Indicator
Identifying fractals manually requires careful chart observation. Traders need to look for five consecutive candlesticks and determine whether the middle candlestick represents the highest or lowest price compared to the surrounding candles.
If the middle candlestick has the lowest price and the two candles on either side have higher lows, a bullish fractal has formed. Conversely, if the middle candlestick has the highest price and the surrounding candles have lower highs, a bearish fractal is present.
Introduction to the Fractal Indicator and How to Use It
The fractal indicator, available on trading platforms such as MetaTrader 4 (MT4) and MetaTrader 5 (MT5), automatically identifies these patterns on the chart. This tool marks points where bullish or bearish fractals have formed, assisting traders in better identifying market trends.
Optimized Settings for the Fractal Indicator in MetaTrader (MT4 and MT5)
The fractal indicator in MetaTrader does not require complex settings and can be used with its default configuration. However, for better accuracy, traders should analyze fractals alongside higher timeframes to improve signal reliability.
Trading Strategies Using Fractals in Forex
Fractals are not merely a tool for observing price patterns; they can also serve as the foundation for designing powerful trading strategies. Combining fractals with other indicators such as moving averages, Ichimoku, or support and resistance creates precise trading opportunities with favorable risk to reward ratios. Professional traders use fractals for breakout entries, setting stop loss levels, identifying market structure, and even filtering counter trend trades. The key to success in using fractals is defining precise entry and exit rules and adhering to them.
Fractal Breakout Strategy
One of the most common ways traders use fractals in Forex trading is through the fractal breakout strategy. In this approach, the trader looks for breakouts of levels identified by bullish or bearish fractals. When a bullish fractal forms in the market, there is a possibility that the price may break above its resistance level in the future. Conversely, a bearish fractal may indicate a potential breakdown of a support level.
In this strategy, the trader typically enters a trade after confirming the breakout. This confirmation can be obtained through factors such as strong breakout candlesticks, increased trading volume, or a combination with other indicators like moving averages or Bollinger Bands. Entering a trade after the breakout is usually accompanied by placing a stop loss behind the last formed fractal to minimize potential losses.
Entry and Exit Strategy Based on Fractal Points
Some traders use fractals as a guide for entering and exiting trades. In this approach, when a bullish fractal forms near a support level, it can serve as a signal to enter a buy position. Conversely, the formation of a bearish fractal near a resistance level may indicate an opportune time to sell.
In this strategy, entry points are usually placed near the fractal breakout, while stop loss orders are positioned behind the last recorded fractal. For exiting trades, a trader may wait for the formation of a reversal fractal. For instance, if a trader has opened a buy position, they might decide to close it when the first bearish fractal appears, thereby securing profits.
Combining Fractals with Other Indicators Like MACD and RSI
One crucial aspect of using fractals is that they do not always provide precise signals on their own. To enhance accuracy, many traders combine fractals with other technical indicators.
One popular method is to use fractals alongside the MACD indicator. In this approach, when a bullish fractal appears near a bullish crossover in MACD, the probability of an upward trend continuation increases. Conversely, a bearish fractal that coincides with a bearish crossover in MACD can confirm a potential downtrend.
Similarly, combining fractals with the RSI indicator can enhance their effectiveness. For example, if a bullish fractal appears when RSI is in the oversold zone, it could be a strong buy signal. On the other hand, if a bearish fractal forms while RSI is in the overbought zone, the likelihood of a price decline increases.
Practical Example and Real Chart Analysis
In a real world example, consider the price of a currency pair like EUR/USD in an uptrend. A trader notices that a bullish fractal has formed near a strong support level. At the same time, the RSI indicator confirms that the market is in an oversold condition. Together, these two signals create a strong indication for entering a buy trade.
After entering the trade, the trader places a stop loss order behind the last bearish fractal to protect against unexpected market fluctuations. As the price rises and approaches a significant resistance level, a bearish fractal forms. At this point, the trader exits the trade, securing their profits before a potential reversal.
Limitations and Challenges of Using Fractals in Forex
Despite their widespread use, fractals also have their own limitations, and using them without proper understanding can lead to false signals and trading losses. The biggest challenge of fractals is their inherent delay, as the pattern is confirmed only after the fifth and final candlestick has formed. Fractals perform very well in ranging markets, but during periods of high volatility they may generate numerous false signals. Therefore, fractals should be used alongside complementary tools and with proper risk management.
False Signals and How to Minimize Them
One of the primary challenges of using fractals is the occurrence of false signals. At times, fractals that appear in the market do not necessarily indicate a trend reversal. This can lead traders to enter positions mistakenly, resulting in potential losses.
To reduce false signals, several techniques can be employed. One of the most effective methods is to combine fractals with higher timeframes. If a bullish fractal appears on the 15 minute chart but the market is in a strong downtrend on the daily timeframe, the likelihood of that fractal being effective is reduced. Additionally, using supplementary confirmations such as moving averages and trading volume can help filter out misleading signals.
Weaknesses of the Fractal Indicator and Ways to Improve Its Performance
The fractal indicator, available in MetaTrader and other trading platforms, is a simple tool for identifying these patterns. However, it also has some drawbacks. One of the main issues is the delay in displaying signals. Since the fractal indicator relies on five consecutive candlesticks, the fractal signal often appears only after a significant price movement has already occurred, causing traders to miss good entry or exit opportunities.
To improve performance, traders can combine fractals with price action techniques or other analytical tools such as trendlines. For instance, a fractal forming near a strong support level may provide a more reliable signal compared to a fractal that appears randomly on the chart.
Comparison of Fractals with Other Technical Analysis Methods
Fractals are one of many methods used to analyze the market, but they differ from other technical tools in several ways. Some analytical approaches, such as candlestick patterns or Elliott Wave Theory, involve more complex interpretations and require greater experience to use effectively.
Unlike indicators like RSI or MACD, which measure the strength of a trend, fractals primarily help identify reversal points. Additionally, unlike moving averages that provide a broad view of trend direction, fractals focus more on specific points on the chart.
For this reason, many professional traders use fractals in conjunction with other analysis methods to develop a more comprehensive view of the market. For example, combining fractals with Fibonacci retracement levels or price action strategies can improve analysis accuracy and increase the likelihood of successful trades.
Fractal Indicator in MetaTrader: How to Add and Analyze It
One of the simplest ways to identify fractal patterns on a Forex chart is by using the built in fractal indicator in MetaTrader. Fortunately, this indicator is available by default in both MetaTrader 4 and MetaTrader 5, and there is no need to download or install any additional plugins. Traders can activate fractals on the chart with just a few simple clicks and visually observe key price reversal points. In addition to highlighting important highs and lows, this indicator serves as a precise tool for determining entry points, exits, and stop loss levels. Although its appearance is simple, when combined with tools such as moving averages, price action, or price channels, it can reveal market structure with a high degree of accuracy. In the following sections, we will review how to activate the indicator and how to perform professional analysis with it, so you can use fractals in MetaTrader in a practical and effective way.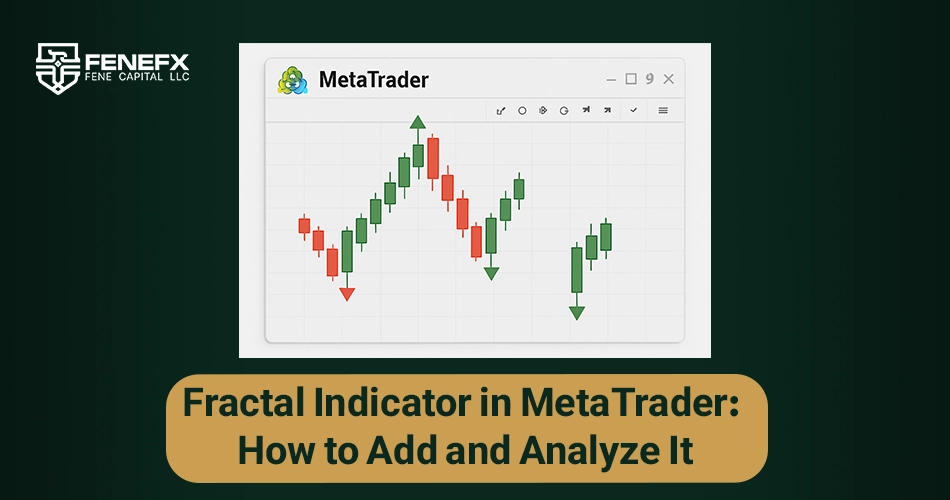
Step by step guide: Adding and configuring the Fractals indicator in MetaTrader (MT4 / MT5)
Note that the standard versions of MT4/MT5 include theFractalsindicator by default. If your MetaTrader version does not have this indicator pre installed, the installation method is explained at the end of this section.
Step 1 - Open the platform and the Navigator window
- Open MetaTrader (MT4 or MT5).
- From the top menu, go toView → Navigator, or use theCtrl+Nshortcut to open the Navigator panel.
Step 2 - Find the Fractals indicator
- In theNavigatorpanel, look under theIndicatorsorCustom Indicatorssection.
- There is usually an indicator namedFractalsorBill Williams — Fractals.
Step 3 - Add Fractals to the chart
- Drag and drop theFractalsindicator onto your desired chart, or right click on its name and selectAttach to a chart.
- The settings window will open (in most implementations, no special configuration is required). The default is usually“Left Bars = 2”and“Right Bars = 2”(which means a 5 candle pattern). Do not change these standard values unless you have a specific reason to.
- ClickOK. You will now see up and down arrows on the chart indicatingbearishandbullishfractals.
Step 4 - Visual check and appearance settings (optional)
- On the chart, right click the indicator name in the top left corner →Properties, or double click it → you can change the color and size of the arrows.
- If you want the fractals to look less cluttered, you can show only the arrows and disable the text.
Step 5 - Manual installation if the indicator is missing
- IfFractalsis not in the list, download the indicator’s.ex4or.mq4file (for MT4) /.ex5or.mq5file (for MT5) from a trusted source.
- In MT4/MT5 go to:File → Open Data Folder→ then open theMQL4\IndicatorsorMQL5\Indicatorsfolder.
- Place the indicator file in that folder and restart the platform. Then add the indicator from theNavigator.
Fractal Indicator Trading Checklist (Printable)
Using fractals is most effective when the trader follows a consistent, rule based structure. Many fractal signals may look attractive at first glance, but they are only worth taking when they align with proper market conditions and sound risk management principles.
For this reason, having a clear checklist before each trade helps prevent emotional or hasty decisions and ensures the trader only enters the market when the probability of success is at its highest.
The checklist below is designed with exactly this goal in mind: simple, practical, and usable for all fractal based strategies whether you trade based on fractal level breakouts or in combination with supporting indicators.
Fractal Indicator Trading Checklist
Item Status
Overall market trend on the higher timeframe is identified (bullish / bearish / sideways) ⬜
Trade is taken only in the direction of the main trend ⬜
The last valid fractal has been identified (bearish for buy / bullish for sell) ⬜
Fractal breakout is confirmed after the candle has closed (not just a momentary touch) ⬜
There is at least one additional confirmation (MA / RSI / MACD / volume / price action) ⬜
Entry is taken at a logical point (confirmation candle or pullback to the fractal level) ⬜
Stop loss is placed beyond the last opposite fractal ⬜
Risk to reward ratio is reasonable, at least 1:2 or better ⬜
Trade is not taken too close to key resistance or support ⬜
Exit plan is defined (take profit / trailing stop / opposite fractal) ⬜
If the fractal structure becomes invalid, the trade is closed without hesitation ⬜
Entry is taken only when all checklist items are checked ⬜
If you have now reached a stage where you have stabilised your trading system based on fractals and are looking for suitable capital to expand your professional activity, this is the best time to enter the world of prop trading. Fenefx, as the first international Iranian prop firm, has made it possible for technical traders to trade with large capital and flexible conditions. It makes no difference whether you trade with fractals or with a combination of price action and indicators; the trade structure, low spreads, and fast order execution at Fenefx create an environment that is fully compatible with your trading strategy. If you are looking for a fast and low risk start, it is recommended that, by purchasing a prop account at Fenefx, you turn your skill into dollar income and enter a new level of professional trading without the need for personal capital.
Final Conclusion
Fractals are one of the powerful tools of technical analysis which, by identifying key price reversal points, can help traders improve the quality of their trade entries and exits. However, the true value of fractals becomes apparent when they are used within the framework of an orderly trading system and accompanied by movement based confirmations. Fractals are not only useful for identifying market structure, but they can also be an important part of trade management, determining the stop loss and even adjusting it step by step. Ultimately, the key to success in using this tool is adherence to your strategy, observing risk management principles, and continuous practice on real charts.
Frequently Asked Questions about Fractals in Forex
Can you trade using only fractals?
No. Fractals must be used together with other confirmations such as trend, moving averages, or price action in order to increase the accuracy of the analysis.
What is the best timeframe for using fractals?
They can be used on all timeframes, but the accuracy and reliability of the signals are higher on higher timeframes such as H4 and Daily.
Do fractals work better in trending markets or ranging markets?
Fractals perform more reliably in trending markets, and in ranging markets the probability of false signals increases.
Where is the best place to set the stop loss in fractal based trades?
The best place for the stop loss is usually behind the last opposite fractal so that, if the structure becomes invalid, the trade is closed quickly.