




What is the Morning Star Candlestick?
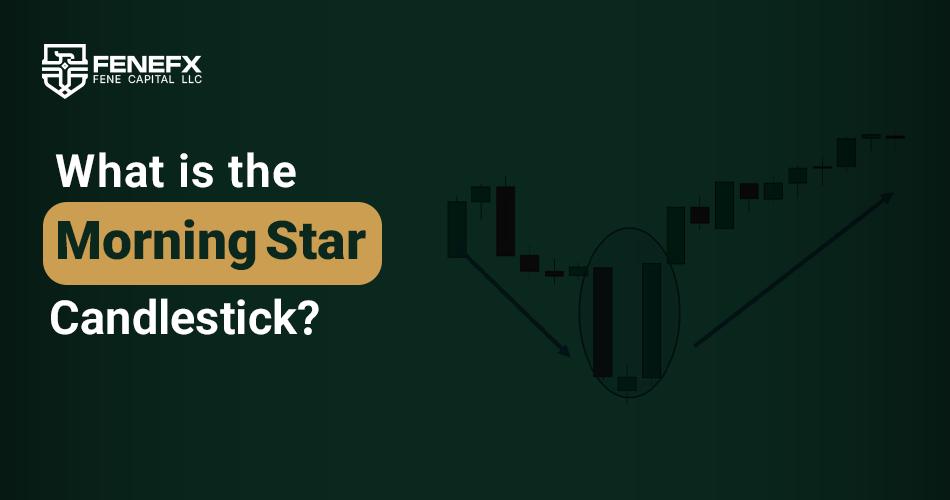
The Morning Star candlestick is one of the most popular patterns in financial markets and trading. It is named the Morning Star because it is recognized as a signal indicating the end of a downtrend and the beginning of an uptrend in the market. This pattern, formed by three distinct candlesticks, reflects a market reversal. Just as the sunrise heralds a new day, the Morning Star pattern forecasts a reversal and the start of a bullish trend.
The Morning Star Candlestick Pattern
In technical analysis, identifying trend reversals is one of the key skills for making informed decisions in the market. Trends in financial markets are generally divided into two main categories: downward and upward. Recognizing the points where these trends reverse can create profitable trading opportunities. To achieve this, using price patterns and analyzing price behavior at specific times is of great importance.
Recognize the Characteristics of the Morning Star Candlestick Pattern
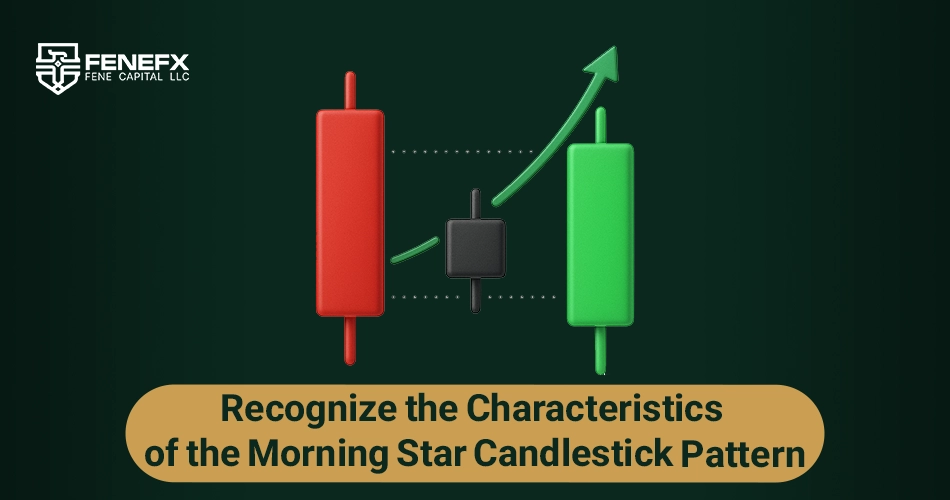
First Candlestick: Long Bearish Candle
This candlestick should be a long bodied bearish candle that strongly continues the preceding downtrend. The purpose of identifying this candle is to show that the market is moving downward and there is strong selling pressure. This candlestick is usually long and should be clearly visible on the chart.
Second Candlestick: Small Candle
This candlestick, often a doji, should be small and indicate indecision in the market. The second candlestick is typically placed with a gap from the first one, which signals a lack of decision between buyers and sellers. This candle can be of various types: doji, hanging man, or a small candlestick with a very short and small body. Also, the second candlestick should be narrow and small and usually appears near the bottom of the first candle.
Third Candlestick: Long Bullish Candle
This candlestick should be a long bodied bullish candle indicating the beginning of an upward market movement. The third candlestick should push the price significantly above the body of the first candle and completely reverse the downtrend. The third candlestick should have a long body and be green (bullish) in color and must be formed at a price higher than the highest price of the first candle.
Pattern Position
To identify the Morning Star candlestick pattern, the first important point is the position where this pattern appears. This pattern must appear at the end of a downtrend to be considered a signal for trend reversal and the start of an uptrend. If this pattern appears in the middle of a trend or after an uptrend, its validity is reduced and it may indicate temporary market fluctuations.
Gap Between Candles
The gap between the candlesticks is another important indicator in identifying the Morning Star pattern. A large gap between the first candlestick (long bearish candle) and the second candlestick (small or doji) indicates a change in market conditions and a potential trend reversal. If the candlesticks are close to each other, the pattern is weaker and may generate a false signal. The greater the gap, the higher the likelihood of a trend reversal.
Trading Volume
Trading volume in the third candle is very important. To confirm the Morning Star pattern, trading volume should increase in the third candle. This volume increase indicates the entry of new buyers into the market and confirms the beginning of an uptrend. If trading volume is low in this candle, the pattern is weaker and the trend reversal may be temporary.
Confirmation by Indicators
Using indicators such as RSI (Relative Strength Index) or MACD helps improve the accuracy of forecasting the Morning Star pattern. For example, if the RSI enters the oversold area and then moves toward the buying zone, it can be a sign of a trend reversal. Also, if the MACD gives a positive crossover, it can serve as a confirmation of the strength of the bullish trend.
Types of the Morning Star Pattern
Recognizing the different types of Morning Star patterns can be useful in analyzing various market conditions and can help traders anticipate trend reversals and shifts in investor sentiment. When used correctly and combined with technical analysis, it can lead to increased profitability and help prevent losses during trading.
Simple Morning Star
This pattern consists of three candlesticks: a long bearish candle, a small candle (or doji), and a long bullish candle. It indicates a complete reversal from a downtrend to an uptrend and is often seen at the end of a bearish trend. The second candle is usually small and reflects market indecision. The third candle appears significantly higher than the first one and confirms the trend reversal.
Inverted Morning Star
This pattern is similar to the simple Morning Star pattern, but instead of a bearish first candle, it starts with a bullish candle. This is followed by a small candle or doji, and then a large bearish candle, signaling a reversal from an uptrend to a downtrend. This pattern is particularly noticeable when an uptrend weakens and a reversal to a downtrend is likely.
Morning Star with Gap
In this variation, there is a price gap between the first and second candles. This gap signifies a sudden shift in market sentiment and strong buying pressure. The pattern typically confirms a stronger reversal and the beginning of an uptrend. The gap in the second candle can serve as confirmation of the pattern’s strength and increase the likelihood of a stronger trend reversal.
Morning Star Doji
This pattern resembles the simple Morning Star, but the second candle is a doji. The doji reflects hesitation or indecision in the market, which is especially important in situations where the market is inclined to change direction. A doji in the second position can be a signal to closely examine market conditions and strengthen the probability of a trend reversal.
Application of the Morning Star Candlestick in Setting Stop Loss
The Morning Star candlestick pattern can be an effective tool for determining stop loss positions in traders’ transactions, as this pattern often appears at the end of a downtrend and indicates a potential shift in the market toward an uptrend. Therefore, considering the specific structure of this pattern, it can be used for risk management and setting stop loss points in the following ways:
Stop Loss Below the First Candle
In many cases, a common method for placing a stop loss in the Morning Star pattern is to set the stop loss below the low of the first candle. Since the first candle (which is a long bearish candle) represents the previous trend and selling pressure in the market, placing a stop loss below this point can help protect against a reversal in case the down trend continues.
Stop Loss Below the Low of the Second Candle
If the second candle is a doji, indicating indecision, the stop loss can be set below the low of the second candle. This means that if the market breaks out of the uncertainty zone and continues its downward trend, you can prevent further losses.
Stop Loss Based on Market Structure and Confirmation of the Third Candle
After the formation of the third candle (a long bullish candle), which signals a trend reversal to the upside, you can move your stop loss to the entry point (Break Even) or even place it at a distance from the entry point to preserve profits. This helps ensure that if the market reverses back to a downtrend for any reason, your trades will not result in a loss.
How to Confirm the Validity and Assess the Reliability of the Morning Star Pattern
To confirm the validity and assess the reliability of the Morning Star candlestick pattern, several factors and indicators should be taken into account. These elements can help ensure that the pattern is indeed legitimate and can serve as a signal for a potential reversal of the market trend toward bullishness. You can evaluate the credibility of this pattern using the following approach:
Pattern Position Confirmation
The first step in confirming the validity of the Morning Star pattern is to examine its position. This pattern must appear at the end of a downtrend. If it appears in the middle or at the beginning of an uptrend, the likelihood of a false reversal signal increases. At the end of a downtrend, the Morning Star pattern signals a shift to an upward trend. If this pattern appears in the middle of a trend, its signal is generally considered unreliable.
Trading Volume
Trading volume should increase in the third candle of the pattern (the bullish candle). This volume increase indicates the entry of new buyers into the market and confirms that the trend reversal from bearish to bullish is genuine. If the trading volume is low in the third candle, it reflects the market’s lack of confidence in the reversal and weakens the pattern’s reliability.
Confirmation by Indicators
To further confirm the Morning Star pattern, you can use indicators such as RSI (Relative Strength Index) and MACD (Moving Average Convergence Divergence). If the RSI moves from the oversold area to the buying zone, it can validate the pattern’s credibility. Therefore, using indicators can enhance confirmation and increase the precision of the signal.
Pattern Combinations and Their Impact on Credibility
If the Morning Star pattern appears alongside other key patterns such as a trendline, resistance line, or Fibonacci levels, its reliability is strengthened. These combinations suggest higher confirmation of the signals and increase the likelihood of a trend reversal.
Trend Reversal Rate
After confirming the pattern, we should expect the price to move upward. If the price fails to break above the high of the third candle and quickly reverses, the pattern’s validity is weakened, and it is likely that the market still favors continuing the downtrend.
Key Trading Strategies Using the Morning Star Pattern
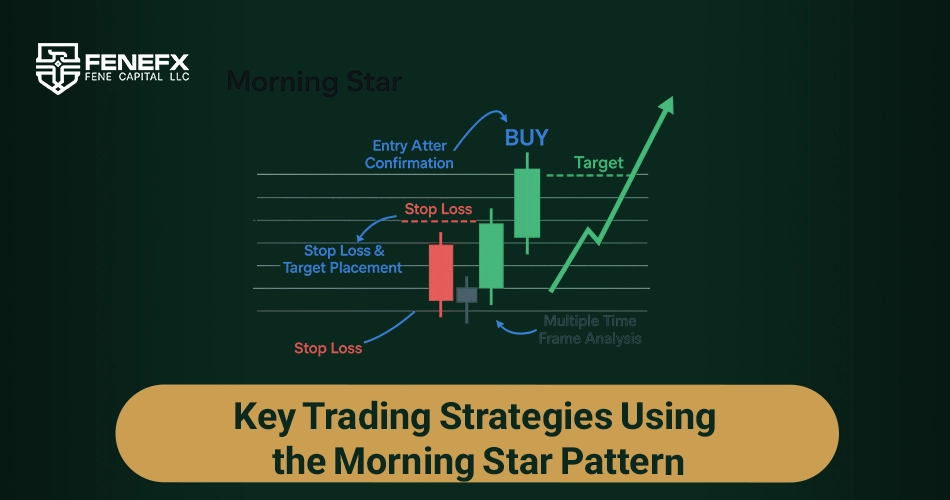
This section of the article examines the most important trading strategies using the Morning Star pattern:
Buy Strategy After Pattern Confirmation
This strategy involves waiting for confirmation of the trend reversal after spotting the pattern on the chart. Confirmation typically occurs with the closing of the third candle (a long bullish candle) and the price moving upward. This gives the trader confidence that the downtrend has ended and the market is shifting into an uptrend.
Stop Loss and Target Setting Strategy
Setting stop loss and target levels is one of the most crucial aspects of using the Morning Star pattern. After entering a trade, it is essential to set an appropriate stop loss level for risk management. Usually, the stop loss is placed below the first candle (bearish candle) or below the low of the second candle (small or doji candle). These points can naturally act as support levels, and if the price reaches these levels, it indicates a resumption of the downward trend.
For setting the target, previous resistance levels or tools such as Fibonacci retracements are commonly used. For example, a trader can place the first target at a previous resistance level or at a Fibonacci retracement level such as 50% or 61.8%. This helps secure profits during the uptrend and avoid potential reversals.
Multi Time Frame Strategy
In this strategy, the trader should first choose a higher timeframe such as the four hour or daily chart to identify the overall market trend. These timeframes typically provide the best view of the general market direction and allow the trader to assess whether the Morning Star pattern has appeared within a downtrend and in the appropriate context.
Once the Morning Star pattern is identified on the higher timeframe, the trader can use a lower timeframe such as the one hour or 15 minute chart to pinpoint more accurate entry points. Lower time frames allow traders to identify precise entry levels and take advantage of quick price movements.
Comments
Simple, visual, and to the point. More candlestick posts please.
Didn't realize the middle candle can be a doji or a tiny body of either color — I kept discarding valid setups because the second candle was green. Thanks for clearing that up!
A morning star on the H4 gold chart was actually my first profitable pattern trade. Still screenshot it when I need motivation on red days.
How reliable is this pattern on lower timeframes like M15? The examples are always daily charts. A stats-based follow-up would be awesome.
Good primer. One nuance: a morning star at random mid-range levels means little. I only rate it after an extended downtrend into a demand zone, ideally with the third candle closing past the midpoint on volume.