




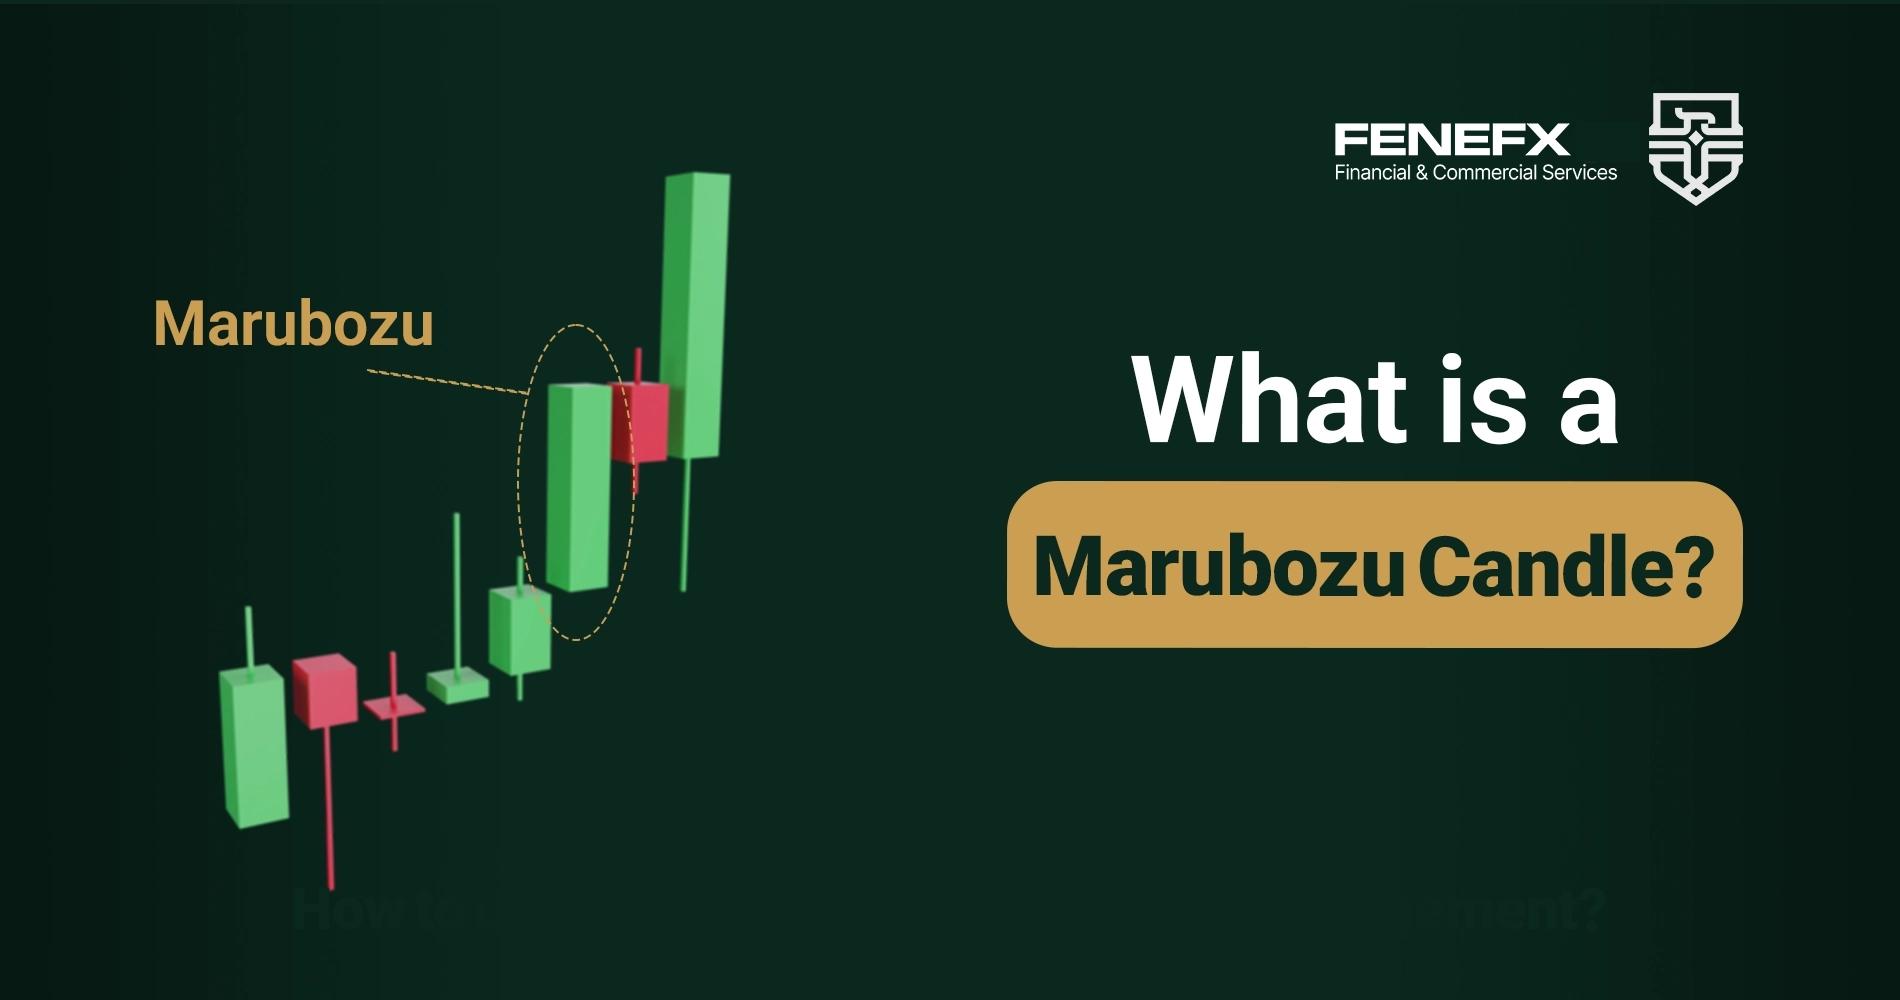
What Is a Marubozu Candle?
A Marubozu candle is one of the clearest and strongest candlestick patterns in technical analysis. Its name is derived from Japanese and means "bald" or "without shadow." This candle indicates the absolute dominance of either buyers or sellers during a specific time frame, as it lacks an upper or lower shadow (or sometimes both). In the simplest definition, a Marubozu candle forms when the opening and closing prices occur exactly at the highest and lowest points of the time period, or very close to them.
The importance of this candle in financial markets especially in Forex lies in the honesty of its message. Unlike some complex patterns that require combined interpretations, a Marubozu sends a clear signal on its own: one side of the market has full control. For this reason, the Marubozu is a fast and powerful tool for real time decision making, particularly for entering or exiting a trade.
Structure and Types of Marubozu Candles
A Marubozu candle has a large body and typically no shadow, or only a very small one. Depending on the type of Marubozu, it can be categorized into several forms, each conveying a specific message on the chart:
Bullish Marubozu
This candle has a green or white body (depending on chart color settings), and the closing price is exactly at the highest point of the day. The absence of a lower shadow means that buyers had complete control from market open to close. The appearance of this candle during a downtrend or after a correction can be a signal of a reversal or the start of an uptrend.
Bearish Marubozu
This type of candle has a red or black body, with the opening price at the highest point and the closing price at the lowest. The lack of an upper shadow indicates that sellers had full control from the beginning to the end of the time period. This candle appearing at price peaks or the end of an uptrend can be a sign of a coming correction or decline.
Full Marubozu
In this case, the candle has no shadows at all. The open and close prices are exactly at the highest and lowest points. This pattern is considered the strongest type of Marubozu and is often accompanied by high volume.
Open/Close Marubozu
In some instances, only one of the shadows is absent. For example, if a candle has no lower shadow but a small upper shadow, it is referred to as a "Close Marubozu."In these cases as well, buying or selling pressure is high, but not as strong as in a Full Marubozu.
Types of Marubozu Candles
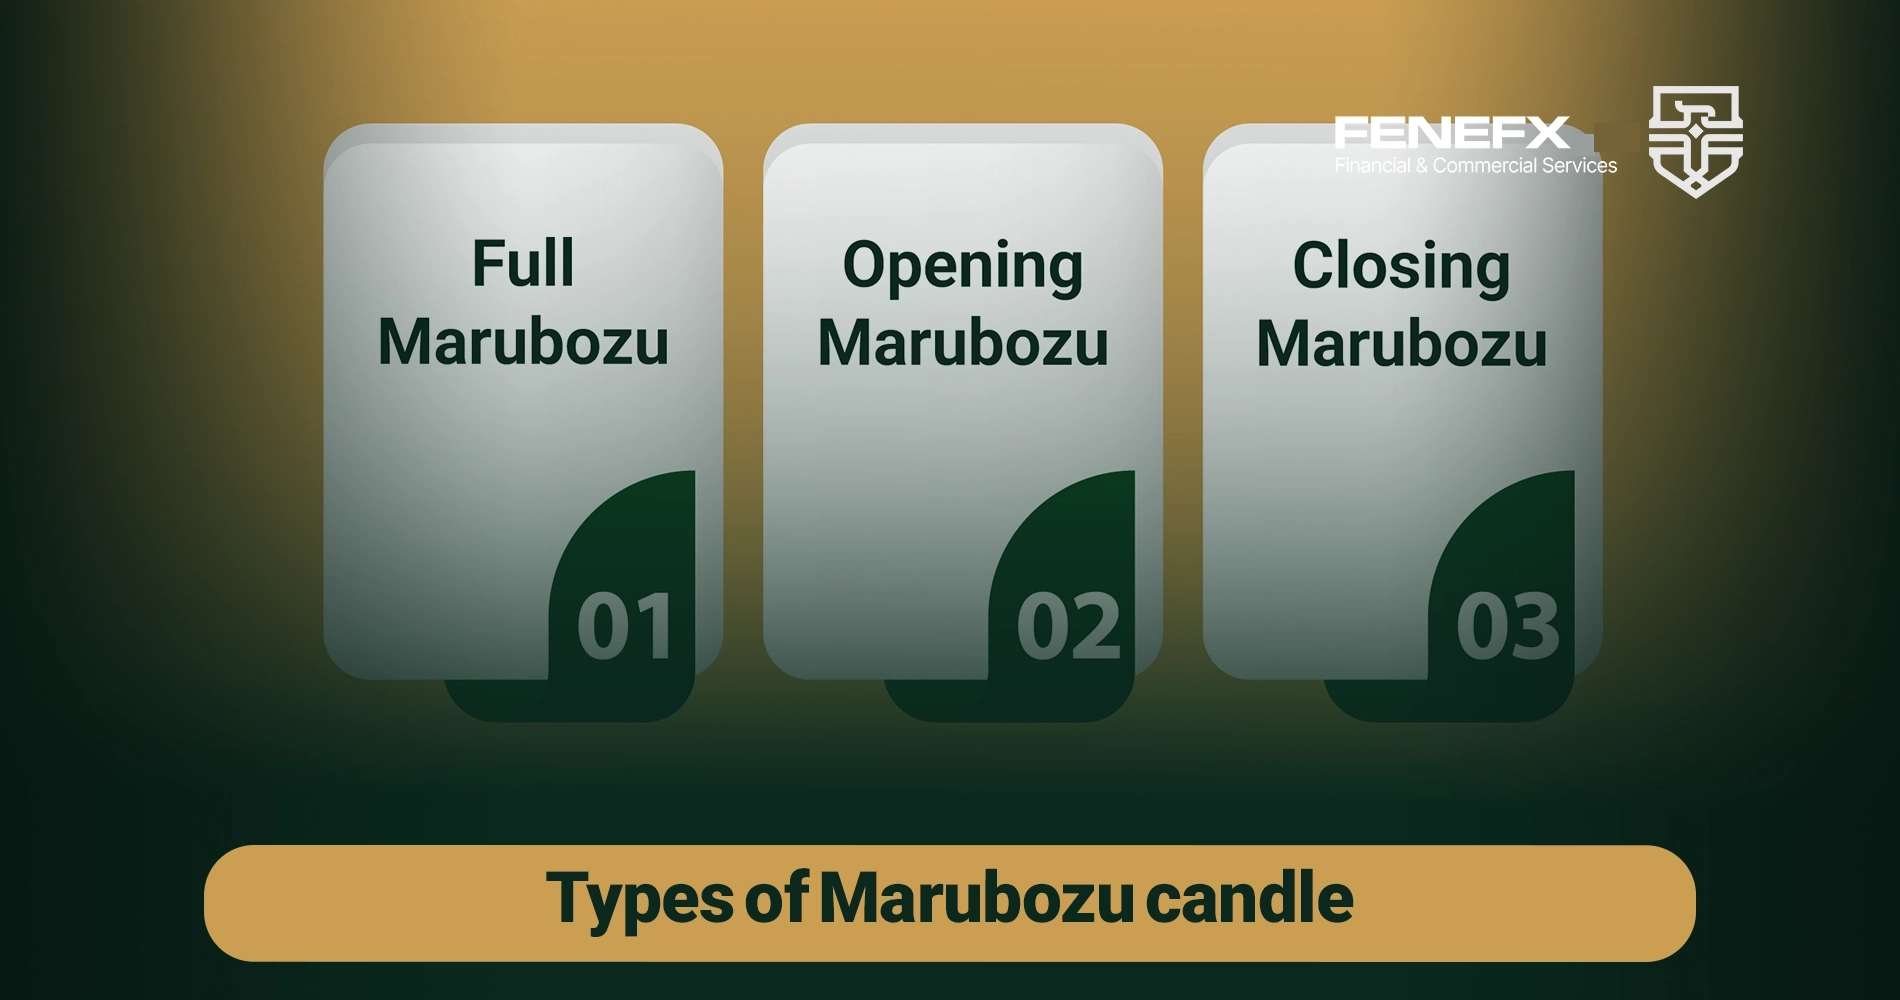
By understanding the different types of Marubozu candles such as Full, Opening, and Closing Marubozu you can accurately analyze the dominance of buyers or sellers in the market:
Full Marubozu Candle
A Full Marubozu candle is one in which there is no shadow on either the upper or lower side of the candle. This type of candle indicates the complete dominance of one side of the market (either buyers or sellers). In a Full Bullish Marubozu, the opening price equals the lowest price and the closing price equals the highest price. In a Full Bearish Marubozu, the opposite is true.
Opening Marubozu Candle
In an Opening Marubozu candle, there is no shadow on the side of the opening price, but a small shadow may appear on the side of the closing price. This type of candle shows that the market initially moved strongly in a specific direction, but lost some momentum by the end of the session.
Closing Marubozu Candle
In a Closing Marubozu candle, there is no shadow on the side of the closing price, but a short shadow may appear on the side of the opening price. This type of candle indicates that, by the end of the time period, the market came under strong buying or selling pressure and reached the session's high or low.
How to Identify a Marubozu Candle
To correctly identify a Marubozu candle, it’s essential to understand its structure. This candle typically has a long body with either no upper and lower shadows or shadows that are very small. The body to shadow ratio in this candle is very high, with the body making up more than 90% of the candle. On higher timeframes (such as daily or weekly), the presence of a Full Marubozu is usually a very powerful signal.
Identifying a Marubozu alone is not enough. To use it effectively, the location of the candle’s formation must also be considered:
Formation of a Marubozu Near a Support Level
If a Bullish Marubozu forms exactly on a strong support level, the likelihood of an uptrend starting increases. This signal becomes even more reliable if trading volume also rises.
Formation of a Marubozu Near a Resistance Level
Conversely, if a Bearish Marubozu appears near or exactly on a resistance level, the probability of a price reversal becomes higher. In this case, the pattern could indicate the beginning of a correction or the end of a bullish wave.
It’s also crucial to consider the candle’s position within the overall chart structure. For example, a Bullish Marubozu at the end of a downtrend can be a reversal signal, while in the middle of an uptrend, it simply confirms the continuation of the trend.
Finally, combining the Marubozu with other tools such as volume, indicators, and classical patterns will enhance the accuracy of your analysis. The Marubozu candle is an excellent standalone tool, but when used alongside other instruments, it becomes a professional and precise tool for traders.
Messages and Signals of the Marubozu Candle
Due to its simple yet expressive structure, the Marubozu candle is considered one of the most important candlesticks for technical analysts. The message conveyed by its appearance is usually very strong and reliable especially when it forms at key chart levels or is combined with other analytical signals.
1) Trend Continuation Warning
One of the most significant messages a Marubozu conveys is the confirmation of the current trend’s strength. If a Bullish Marubozu appears during an uptrend, it indicates that buyers still strongly control the market, and the likelihood of continued upward movement is high. A similar scenario in a downtrend, where a Bearish Marubozu appears, shows that sellers are dominating.
2) Possible Reversal Signal
Marubozu also plays a role at reversal levels, especially when it appears after a prolonged trend. For instance, if the price has been declining for an extended period and reaches a strong support level, and then a Bullish Marubozu forms, this could be an early signal of a potential trend reversal.
3) Signal Reinforcement at Key Levels
The formation of a Marubozu near static support or resistance zones, trendlines, supply and demand areas, or Fibonacci levels makes the signal more reliable. The combination of the candle’s structure and its location is a critical factor in final decision making, and one should not rely solely on the candle itself.
Marubozu Signal Confirmation Tools
To use the Marubozu candle professionally, it should be combined with other tools. One dimensional signals always carry a degree of error, but when multiple tools align, trades can be executed with greater confidence.
Volume
An increase in volume during the formation of a Marubozu especially on higher timeframes (such as 4 hour or daily) is one of the strongest confirmations of the signal’s validity. If a Bullish Marubozu forms with high volume, it is likely that a strong uptrend is on the way. Conversely, high volume accompanying a Bearish Marubozu indicates heavy selling pressure.
Moving Average
If the Marubozu candle appears above the 50 or 100 period Exponential Moving Average (EMA), the likelihood of trend continuation increases. If the price is below these lines and a Bearish Marubozu forms, it confirms the bearish trend.
RSI Indicator
Combining the Marubozu candle with the RSI indicator can produce strong confluence signals. If the RSI is in the oversold zone and a Bullish Marubozu forms, a price reversal is likely. On the other hand, if RSI is in the overbought zone and a Bearish Marubozu appears, it signals the beginning of a correction or decline.
Confirmation Using Multiple Technical Elements
Simultaneous use of Fibonacci levels, trendlines, breakout zones, or even classical patterns like double bottom or double top can add more credibility to the Marubozu signal. Professional traders usually look for confluence between several tools to make more accurate decisions.
Trading Strategies with the Marubozu Candle

To effectively use the Marubozu candle in trading, you need a clear plan for entry, exit, risk management, and target setting. Below are some key strategies for utilizing this pattern:
Entering a Trade After Candle Close
One of the golden rules of using the Marubozu candle is to enter a trade only after the candle has fully closed. Entering during the candle’s formation carries high risk, as its final structure may change.
Setting a Stop Loss
In a Bullish Marubozu, the stop loss can be set slightly below the candle’s low. In a Bearish Marubozu, the stop loss is placed slightly above the candle’s high. This approach helps limit risk in case of a sudden market reversal.
Setting a Take Profit
Targets should be based on market structure and other tools. You can use support and resistance levels, Fibonacci lines, or the ATR to set your take profit. A commonly recommended risk to reward ratio is at least 1:2.
Practical Example in an Uptrend
Suppose on the EUR/USD chart, a Bullish Marubozu forms on the 1 hour timeframe at a previous support level, and the RSI is in the 30 range. If volume has also increased, a buy position can be considered after the candle closes. The stop loss is placed below the candle’s low, and the target is set at the next resistance level.
Use in Reversal or Continuation Trades
Marubozu can be used in both reversal and continuation strategies. For a reversal, it should form at key levels and be accompanied by divergence or a trendline break. In continuation scenarios, confirmation from the Marubozu suggests the current market direction is likely to persist.
In conclusion, while the Marubozu candle has a simple structure, it can become a serious part of a professional trader’s strategy provided it’s used with precision, multiple confirmations, and proper risk management.
Real Advantages and Limitations of the Marubozu
The Marubozu candle is one of the simplest yet most powerful candlestick patterns in technical analysis. Its clear, shadowless structure sends a strong and unambiguous message of one sided dominance either by buyers or sellers. However, like any tool, the Marubozu also has its own limitations, and being aware of them is essential for effective use and avoiding mistakes.
Below, we’ll examine the advantages and limitations of this candle in table format to give you a comprehensive understanding of its practical application.
| Advantages | Limitations |
| Fast and easy to understand signal | Can be misleading in highly volatile markets |
| Suitable for short term and swing trading | May have low reliability on lower timeframes |
| Strong emphasis on the current trend’s strength | Requires confirmation from other tools for greater validity |
| Easily recognizable on the chart | Its signal may be temporary and simply reflect a moment of market emotion |
| Can be combined with complementary tools like RSI, MA, Volume | Has limited effectiveness in sideways or low volume markets |
| Useful for breakout points or trend continuation | Cannot independently define precise entry or exit points |
How to Use Marubozu to Predict Future Trends
The Marubozu candle, with its shadowless structure and full body, is a clear sign of absolute strength from either buyers or sellers during a specific time frame. This very feature has made it a popular tool among traders for anticipating trend continuations or potential reversals. However, the key point is this: the Marubozu should not be used in isolation as a basis for decision making it must be applied within the broader context of technical analysis and overall market conditions.
If a Bullish Marubozu forms near a support level and is accompanied by high volume, the likelihood of an ongoing uptrend is high. Conversely, if a Bearish Marubozu appears near a resistance level and at the end of an uptrend, it may signal the beginning of a correction or even a market reversal. This pattern is commonly used to identify potential entry and exit points within trend following or reversal strategies.
To forecast future trends, the most effective use of the Marubozu is when it is combined with tools such as moving averages (to determine the general market direction), indicators like RSI (to assess overbought or oversold conditions), and key price levels (support/resistance). For example, if a Bullish Marubozu forms above a 50 period moving average, it can serve as a confirmation of the current bullish trend’s strength.
Ultimately, the intelligent use of the Marubozu candle alongside other analytical factors not only enhances the accuracy of your analysis but also increases your ability to more precisely predict future price movements.
Practical Tips for Traders
To effectively benefit from the Marubozu candle, simply recognizing its appearance is not enough. Market conditions, timeframe, trading session, and other technical factors must be considered for this simple yet powerful tool to yield practical results.
Optimal Timing for Using Marubozu
Marubozu candles are more reliable on higher timeframes such as 1 hour, 4 hour, and daily charts. On lower timeframes (like 5 minute or 15 minute), high volatility often leads to the formation of false Marubozu candles. It’s also recommended to use this pattern during high liquidity periods such as the overlap of the London and New York sessions since price manipulation is less likely during these times.
Combining with Volume and Other Tools
The Marubozu provides a more valid signal when accompanied by increased volume. For example, a Bullish Marubozu forming at a support level with a sudden volume spike confirms strong buying pressure. Indicators such as RSI, MACD, and moving averages can also provide valuable confirmation for entry or exit when used alongside Marubozu.
Volume adjustment and Risk Management
No signal is 100% certain. Therefore, when trading based on Marubozu candles, position size should always be calculated based on risk tolerance, stop loss distance, and account size. Using an appropriate risk to reward ratio (such as 1:2 or 1:3) is essential for setting effective targets.
Economic News and Events
Avoid entering trades solely based on Marubozu patterns during the release of major economic news. For instance, during announcements like interest rate decisions or U.S. employment reports, Marubozu candles may form due to news driven spikes and reverse quickly thereafter.
Practice on Demo Accounts and Backtesting
Before using the Marubozu candle in a live trading account, it’s best to practice with it in a demo environment. Backtesting the pattern on historical data will also help you better understand how the market reacts to it under different scenarios.
Marubozu is a useful but complementary tool. Thoughtful usage and intelligent integration with other technical tools will help you make more precise and confident trading decisions.
Comments
Saw a perfect bearish marubozu on GBPJPY last week and ignored it... price dropped 120 pips right after. Never again lol.
Could you do a follow-up comparing marubozu with engulfing candles? I keep confusing which one matters more at support and resistance.
Clean explanation, saved to my notes. 👍
Honestly I always mixed these up with regular long candles. The bit about no wicks meaning full control by buyers or sellers finally made it click, thanks!
One nuance: a marubozu on a 5-minute chart doesn't mean much. I only pay attention when it prints on the 4h or daily near a level people are actually watching.