
What is Ichimoku Indicator?
the Ichimoku indicator is a comprehensive technical analysis tool that, with just one glance, can simultaneously show you the market trend, support and resistance levels, and buy and sell signals. By combining its five main components, this indicator not only clarifies the current state of the market but also has the power to predict future price movements. For this reason, Ichimoku is exactly what traders who are looking for a complete and practical tool for precise decision-making need.
What is Ichimoku Indicator and How Does it Work?
Ichimoku indicator is one of the complex yet effective technical analysis tools used to identify market trends, support and resistance levels, as well as buy and sell signals. This indicator was designed by "Goichi Hosoda" in the 1960s and is known as a comprehensive tool for market analysis. Ichimoku means "one glance" in Japanese, as its purpose is to provide all necessary information for market analysis at a glance. This indicator consists of several different components, each playing a specific role in market analysis.
Structure and Main Components of Ichimoku
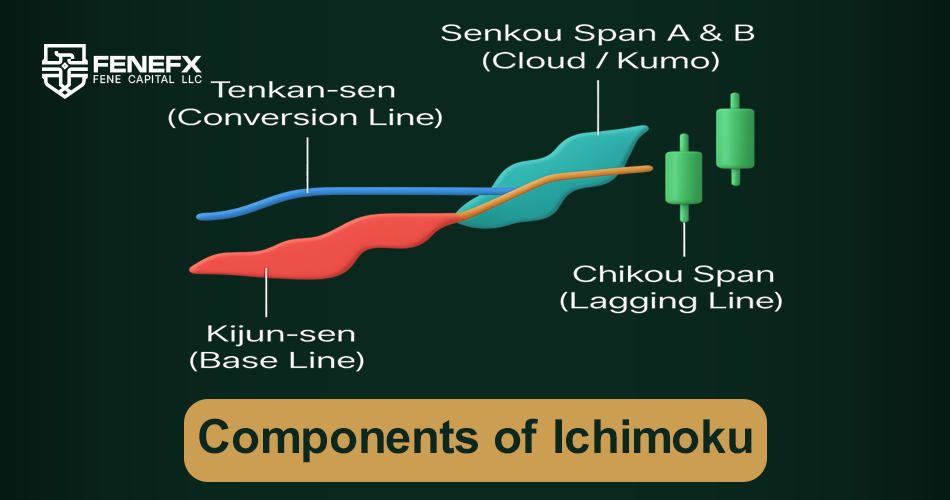
The Ichimoku indicator consists of five main components, each providing different information to the trader. These components are: Tenkan-Sen, Kijun-Sen, Kumo Cloud, Chikou Span, and Senkou Span (A and B). Each of these components specifically helps in analyzing market trends and predicting price movements.
History and Design Philosophy of Ichimoku
Ichimoku was initially designed by Goichi Hosoda, a Japanese journalist, for stock market analysis. Hosoda's goal in designing this indicator was to create a tool that could simultaneously present all important market information at a glance. The design philosophy of Ichimoku is based on creating an overall view of market trends and identifying key points such as support and resistance levels. In fact, Ichimoku is a market analysis tool in which all components work in harmony to provide comprehensive and accurate results.
Components of Ichimoku
What is Tenkan-Sen and How is it Calculated?
Tenkan-Sen, also called the "fast turning line," is a simple moving average calculated using the highest and lowest prices of the past 9 periods. This line is typically used as a fast indicator for short term changes in market trends. Tenkan-Sen is usually used as an initial signal to identify trend changes and entry points. When price crosses this line, it can act as a buy or sell signal.
What is Kijun-Sen and What is its Function?
Kijun-Sen or the "slow turning line" is another moving average calculated from the highest and lowest prices of the past 26 periods. This line typically indicates the medium term market trend and is used as a signal to predict future price movement. When the price is above the Kijun-Sen, it's usually considered an uptrend, and when the price is below it, it's considered a downtrend. Also, like Tenkan-Sen, if the price crosses the Kijun-Sen line, it can signal a trend change.
What is Kumo Cloud and How is it Interpreted?
Kumo or Kumo Cloud is one of the most important parts of the Ichimoku indicator, consisting of two lines, Senkou Span A and B. This cloud acts as a dynamic support and resistance level. Senkou Span A and B are calculated from the average prices of the past 26 periods and 52 periods, respectively. When the price is above the Kumo cloud, it indicates an uptrend, and when the price is below the Kumo cloud, it indicates a downtrend. In fact, this cloud can be used as a prediction for future price movements.
Chikou Span and its Role in Analysis
Chikou Span is one of the important components of Ichimoku, known as the "lagging line." This line shifts the current closing price back 26 periods. The main purpose of Chikou Span is to analyze the behavior of prices relative to the past and provide a view of historical market trends. Chikou Span can act as a confirmation for the current trend. For example, if Chikou Span is above prices, this may be interpreted as a buy signal, and if it is below prices, as a sell signal.
Main Applications of Ichimoku Indicator
Identifying Bullish and Bearish Trends
One of the main applications of Ichimoku is identifying market trends. Ichimoku clearly shows bullish and bearish trends using its various components such as Tenkan-Sen, Kijun-Sen, and Kumo Cloud. When the price is above the Kumo cloud and Tenkan-Sen is above Kijun-Sen, this indicates a bullish trend, and conversely, when the price is below the Kumo cloud and Tenkan-Sen is below Kijun-Sen, it's a bearish trend.
Determining Support and Resistance Levels
The Kumo cloud acts as a dynamic support and resistance level. In fact, this cloud can not only determine the range of price fluctuations but also indicates the strength or weakness of a trend. When the price is above the Kumo cloud, the upper level of the cloud acts as a support level, and when the price is below the cloud, the lower level of the cloud acts as resistance.
Use in Different Timeframes
Ichimoku is effectively usable in different timeframes. This indicator works ideally for long term traders who trade in daily or weekly timeframes. Also, for short term traders, Ichimoku can be useful in short term timeframes such as 1 minute or 5 minutes. Using Ichimoku in different timeframes allows flexibility in trading strategies, and traders can receive more accurate signals.
Trading Strategies with Ichimoku
Tenkan-Sen and Kijun-Sen Cross Strategy
One of the most popular strategies in Ichimoku is the cross or passing of Tenkan-Sen and Kijun-Sen lines. This strategy is executed when the Tenkan-Sen line crosses above the Kijun-Sen line, which is called a "bullish cross" and is considered a buy signal. Conversely, when the Tenkan-Sen line crosses below the Kijun-Sen line, this is called a "bearish cross" and is considered a sell signal. These crosses are usually usable in conditions where there is a specific trend in the market and provide reliable signals.
In this strategy, in addition to the crossing of lines, attention should be paid to the position of the price in relation to the Kumo cloud. For example, if a bullish cross occurs while the price is above the Kumo cloud, this is a strong signal for buying. Conversely, if a bearish cross is below the Kumo cloud, this confirms the sell signal.
Trading Strategy Based on Kumo Cloud
Trading strategies based on the Kumo cloud are among the popular Ichimoku strategies. The Kumo cloud naturally plays the role of dynamic support and resistance. In this strategy, traders look for opportunities where price crosses the Kumo cloud and moves towards new levels.
For a buy signal, the price must cross from below the Kumo cloud to above it, and as confirmation, the Tenkan-Sen and Kijun-Sen lines must cross from bottom to top, respectively. In this case, the uptrend is confirmed, and the trader can enter a buy trade. For a sell signal, the opposite is true, meaning that the price must cross from above the Kumo cloud to below it, and the Tenkan-Sen and Kijun-Sen lines must cross from top to bottom.
Using Chikou Span to Confirm Signals
Chikou Span or the lagging line is one of the important components of Ichimoku that can play a role in confirming trading signals. In this strategy, if Chikou Span is above prices, this is a sign of an uptrend, and buy signals are confirmed. Similarly, if Chikou Span is below prices, this is a sign of a downtrend, and sell signals are validated.
Chikou Span can also act as a warning signal for trend changes. When Chikou Span suddenly changes direction, this can indicate a potential reversal in the market trend.
Principles of Proper Use of Ichimoku Indicator
Selecting the Appropriate Time Frame
Selecting the appropriate time frame is one of the key principles in using the Ichimoku indicator. Ichimoku is specifically designed for long term timeframes, but this doesn't mean it can't be used in shorter time frames as well. For long term traders, using daily or weekly timeframes will give the best results, as in these timeframes, the Ichimoku indicator can well simulate long term trends and dynamic support and resistance levels.
For short term traders, lower time frames such as 15 minutes or one hour can be useful. However, in these timeframes, false signals may also be produced, which is why it is necessary to use other technical analysis tools to confirm signals.
Combining Ichimoku with Other Technical Analysis Tools
Using Ichimoku alone can be effective, but the best result is achieved when this indicator is combined with other technical analysis tools. For example, traders can combine Ichimoku with other common indicators such as RSI, MACD, or Stochastic to obtain more accurate signals.
Also, using price patterns such as candlestick patterns and price action can act as additional confirmations for Ichimoku signals. Combining these tools creates stronger buy and sell signals and reduces the likelihood of false signals.
Key Points to Avoid False Signals
One of the major challenges in using Ichimoku is the false signals that may occur in trendless markets or in oscillating conditions. To avoid this problem, it is recommended to use Ichimoku signals only in conditions where a clear trend is observed in the market. In fact, Ichimoku works better in markets that have a specific trend, and in directionless or trendless markets, it may create false signals.
In addition, you should regularly check the Ichimoku settings and align them with your market conditions and trading timeframe. This will make Ichimoku signals more accurate and efficient.
Advantages of Using Ichimoku
advantages:
Comprehensive Market Analysis at a Glance
One of the biggest advantages of the Ichimoku indicator is its ability to provide comprehensive market analysis at a glance. Unlike many other indicators that only address specific parts of the market, Ichimoku encompasses all important dimensions of the market, including trends, support and resistance levels, buy and sell signals, and trend reversal points.
Its Application in All Financial Markets (Forex, Stocks, Cryptocurrency, etc.)
Another advantage of Ichimoku is that it can be used in all financial markets. Regardless of whether you trade in forex, stocks, cryptocurrencies, or commodities, Ichimoku serves as a practical and comprehensive tool in each of these markets. For this reason, this indicator is known as a universal tool in financial markets.
Compatibility with Different Timeframes
Ichimoku is effectively usable in different timeframes. This indicator is not only suitable for long term traders who operate in daily or weekly timeframes but is also usable for short term traders. This flexibility makes Ichimoku one of the popular tools among traders.
Disadvantages and Limitations of Ichimoku Indicator
Limitations and disadvantages:
Complexity in Understanding and Learning
One of the most important disadvantages of the Ichimoku indicator is its complexity for beginners. This indicator consists of five different components, each playing a specific role in market analysis. For someone who does not yet have sufficient mastery of technical analysis, understanding how Ichimoku functions and interpreting its signals can be challenging. In addition, traders need to learn how to properly combine these components to obtain an accurate analysis of the market. For this reason, Ichimoku may be a bit complex for those who have just entered the world of technical analysis.
Not Suitable for Trendless Markets
One of the major limitations of Ichimoku is its low efficiency in trendless markets. Ichimoku is a tool designed to identify trends, so in markets that don't have a clear trend or move horizontally, it may generate incorrect signals. In such conditions, Ichimoku may repeatedly send false buy and sell signals, causing confusion for traders and trading mistakes. This is especially challenging for traders who are looking for short term strategies based on market oscillations.
Possibility of Generating False Signals in Specific Conditions
The Ichimoku indicator may issue false signals in specific conditions. For example, when the market experiences severe fluctuations or when influential economic news is released, Ichimoku may not be able to accurately predict the market trend. These false signals may cause missing trading opportunities or even significant losses. Therefore, the use of Ichimoku should be done carefully and in combination with other technical analysis tools to reduce the probability of false signals.
Comparing Ichimoku with Other Indicators
Difference Between Ichimoku and Moving Average
One of the main differences between Ichimoku and moving averages is that Ichimoku includes several different components that simultaneously provide more comprehensive information to the trader. While a moving average only refers to an average line of past prices, Ichimoku, by combining different lines, the Kumo cloud, and Chikou Span, allows the trader to have a more accurate analysis of trends, support and resistance levels, and trend reversal points. Moreover, Ichimoku, as a multifaceted tool, is capable of simulating more diverse analyses of the market, which gives the trader more information compared to simple moving averages.
Advantages of Ichimoku Over RSI and MACD
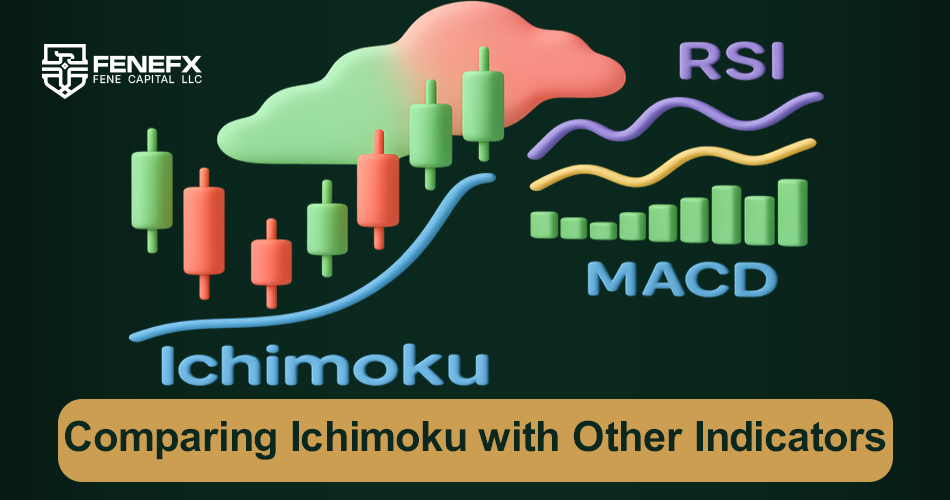
RSI and MACD are among the popular indicators in technical analysis that mainly focus on identifying overbought and oversold conditions. While these indicators operate based on a specific criterion (i.e., overbought or oversold level), Ichimoku is a multifaceted tool that can simulate market trends, support and resistance levels, and entry and exit points more comprehensively. Moreover, Ichimoku is capable of identifying long term trends, while RSI and MACD are more used for short term analyses and identifying divergences.
Why is Ichimoku a More Comprehensive Tool?
Ichimoku, as a more comprehensive tool compared to other indicators, can well simulate market trends. This indicator, using five different components, gives the trader the ability to identify dynamic support and resistance levels, detect bullish and bearish trends, and confirm buy and sell signals at one time. Unlike many indicators that only focus on one aspect of the market, Ichimoku provides an all around analysis of the market situation and can help the trader gain a clearer view of market developments.
Different Settings and Setups of Ichimoku
Default Settings and Changing Them for Different Markets
The default settings of Ichimoku include periods of 9, 26, and 52 for Tenkan-Sen, Kijun-Sen, and Senkou Spans. These settings are typically usable in most markets and timeframes. However, in some specific conditions and for different markets, you may need to change these settings. For example, in volatile and fast markets like cryptocurrencies, you may need to reduce the periods to receive faster signals. In contrast, in markets with long term trends like stocks, using longer periods, such as 14, 30, and 60, may have better efficiency.
Popular Trading Setups with Ichimoku
One of the most popular trading setups with Ichimoku is using the cross of Tenkan-Sen and Kijun-Sen lines. This setup is activated when Tenkan-Sen crosses Kijun-Sen, and this signal is considered as an entry point for trading. Also, using the Kumo cloud as a dynamic support and resistance level is another popular setup. In this setup, the trader looks for price crossing the Kumo cloud to enter a trade.
Combining Ichimoku with Price Action and Other Leading Indicators
To increase the accuracy of Ichimoku signals, it can be combined with other technical analysis tools such as price action, RSI, or MACD. For example, if a buy signal is received from Ichimoku and this signal is confirmed by a candlestick pattern such as a hanging man or doji pattern, the probability of success for this trade increases. This combination causes the trader to receive stronger signals and reduces the probability of false signals.
Comments
Always avoided this indicator because it looked so cluttered. Breaking down each line separately finally made the Kumo cloud make sense to me. Thanks!
Do the default 9-26-52 settings still make sense for crypto and 24/7 markets, or should they be adjusted? Would love an article on that.
Best plain-English Ichimoku explainer I've come across.
I ignored Ichimoku for ages because the chart looked like spaghetti. Forced myself to learn it component by component last year and now it's my main system.
Solid intro. My two cents after years with Ichimoku: it's brilliant in trending markets and nearly useless in ranges. Check market structure first, then trust the cloud.