




What is an Oscillator?
The word "oscillator" literally means "that which oscillates" and in technical analysis, it refers to a tool that measures and analyzes price changes within a specific range. This tool helps analysts identify overbought or oversold conditions. Simply put, an oscillator tells you whether the market has grown excessively and may be due for a correction, or has fallen too much and is ready for a rebound. One of the main reasons oscillators are popular in technical analysis is their ability to provide accurate signals in ranging markets (markets without a clear trend). In such conditions where price fluctuates within a limited range, using oscillators can help you find appropriate entry and exit points.
The Difference Between Oscillators and Indicators: Which is Better for Analysis?
One common question among traders is how oscillators differ from other indicators and when to use them.
Indicators are generally divided into two main categories: oscillators and trend indicators. While both of these tools help analysts predict price behavior, their applications and functions differ.
Trend indicators, such as Moving Averages or Bollinger Bands, are designed to identify the overall direction of market trends. These tools help you understand whether the market is rising or falling, and find the best time to enter a trade. However, the problem arises when the market is in a ranging or trendless state; in such conditions, trend indicators typically provide false signals.
In contrast, oscillators are designed to identify price reversal points in the market and typically oscillate within a specific range (such as 0 to 100). This feature makes oscillators perform much better in ranging conditions (when the price fluctuates within a specific range). In other words, oscillators are useful when the market lacks a clear trend and you need to identify overbought or oversold points.
Therefore, choosing between oscillators and trend indicators depends on market conditions and your trading strategy. If the market is trending, trend indicators are the best choice. But if the market is in a ranging state, oscillators will be an appropriate tool for decision-making.
Types of Oscillators: Which One is More Suitable for Your Strategy?
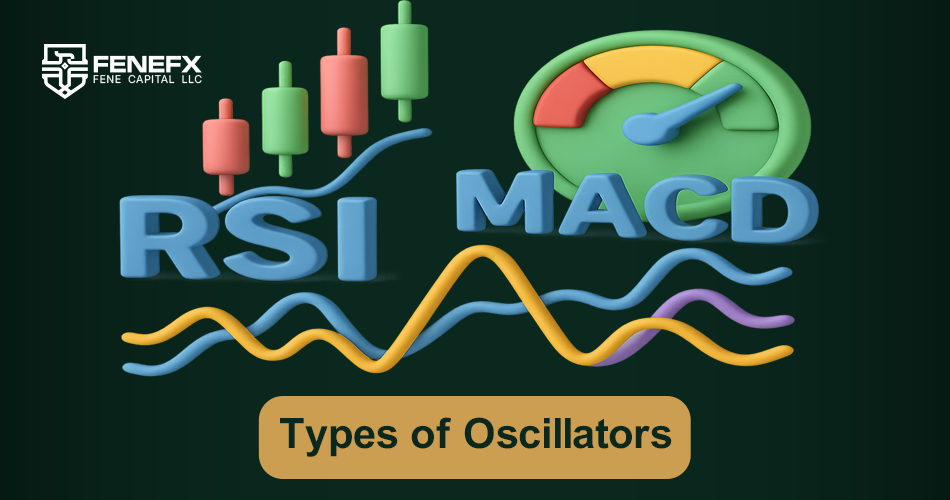
In technical analysis, oscillators are diverse tools, each with its own features and applications. Choosing the most appropriate oscillator depends on your trading strategy and market conditions. Below, we examine some of the most widely used oscillators and discuss their functions and applications.
Relative Strength Index (RSI)
The Relative Strength Index (RSI) is one of the most popular oscillators in technical analysis, designed by "Wells Wilder." This tool oscillates between 0 and 100, and its purpose is to measure the strength of price movement. RSI helps you identify overbought or oversold conditions. For example, if the value of this index is above 70, it indicates that the market is in an overbought condition and the price may soon decrease. Similarly, if the RSI value falls below 30, it indicates oversold conditions and the possibility of a price increase. Another important application of RSI is identifying divergences between this index and price movement, which can be a sign of a potential trend change.
Moving Average Convergence Divergence (MACD)
The Moving Average Convergence Divergence (MACD) is another widely used tool for identifying changes in market trends. MACD consists of two moving averages and measures the difference between them. This oscillator is specifically designed to identify entry and exit points and helps analysts gauge the strength of a trend. For example, when the MACD line crosses the signal line upward, a buy signal is generated. Conversely, when the MACD line crosses the signal line downward, a sell signal is generated. In addition to determining entry and exit points, MACD can also show changes in trend strength, which makes it a powerful tool for trend analysis.
Stochastic Oscillator
The Stochastic Oscillator is a tool used to identify overbought and oversold points in the market. This oscillator also fluctuates between 0 and 100 and is specifically designed for ranging markets. When the stochastic value reaches above 80, it indicates overbought conditions and the possibility of a price decrease. Conversely, when this index value falls below 20, it indicates oversold conditions and the possibility of a price increase. One of the important features of the stochastic oscillator is that it can also identify divergences. For example, if the price is increasing but the stochastic decreases, this could be a sign of weakness in the uptrend and the possibility of a price reversal.
Commodity Channel Index (CCI)
The Commodity Channel Index (CCI) is another useful oscillator that is primarily used to identify price deviation from its historical average. This tool is very common in commodity markets but is also used in stock and forex analysis. The CCI value typically oscillates between -100 and +100. If the value of this index exceeds +100, it indicates strong buying pressure and the market may be in an overbought condition. Likewise, if the CCI value falls below -100, it indicates strong selling pressure and the possibility of a price reversal. This oscillator is particularly useful for identifying short-term trends and price reversal points.
Each of these oscillators can help you better analyze the market, but the important point is that no oscillator is complete on its own. Combining these tools with other technical analysis methods, such as price action or trend indicators, can improve your decision-making and reduce trading risk.
How Do Oscillators Show Precise Entry and Exit Points?
One of the most important applications of oscillators is identifying precise entry and exit points in trades. These tools help traders identify trading opportunities and make more informed decisions by measuring buying and selling pressure in the market and analyzing price changes.
Oscillators typically fluctuate within a specific range (such as 0 to 100 or -100 to +100) and indicate key points, such as overbought and oversold areas. When the price enters these areas, a price reversal may soon occur. For example:
• Overbought: When an oscillator indicates that the price has risen to a level where there is not much demand left in the market, the likelihood of a price decrease increases. This condition issues a sell signal.
• Oversold: Conversely, when the price has fallen to a level where there is excessive supply in the market, the likelihood of a price increase is greater. This condition issues a buy signal.
To clarify this concept, we can use the Relative Strength Index (RSI) as an example. If the RSI value rises above 70, it indicates overbought conditions and the price may soon decrease. In this situation, traders typically look for exit points from trades or even enter short positions. Conversely, if the RSI value falls below 30, it indicates oversold conditions, and traders typically look to enter the market or buy assets.
Other oscillators like MACD can also show entry and exit points using the crossover of signal and MACD lines. When the MACD line crosses above the signal line, it typically generates a buy signal. Similarly, the stochastic oscillator helps you find the best time to trade by analyzing its position relative to the 80 and 20 values.
The important point is that traders should use oscillators along with other technical analysis tools to receive more accurate signals. For example, combining oscillators with support and resistance lines or price patterns can help you avoid false signals and make better decisions.
Advantages and Limitations of Oscillators: Are They Always Reliable?
Oscillators are very useful tools in technical analysis, but like any other tool, they have their own advantages and limitations. Awareness of these can help you use them more effectively and avoid common mistakes.
Advantages of Oscillators
One of the most important advantages of oscillators is that they can perform very well in ranging markets (when price fluctuates within a specific range). In such conditions, where trend indicators typically give false signals, oscillators can help you identify reversal points.
Oscillators also allow you to measure buying and selling pressure in the market and identify overbought or oversold conditions. This feature is especially useful for traders looking for short-term trades.
Another advantage of oscillators is that they can identify divergences. Divergence occurs when price movement and the oscillator move in different directions, which can be a sign of trend change. This capability of oscillators helps you predict potential changes in price.
Limitations of Oscillators
Despite their many advantages, oscillators also have limitations. One of the most important limitations is that they may provide false signals in trending markets. For example, if the market is in a strong uptrend, the oscillator may enter the overbought area too soon and mistakenly lead you to sell, while the uptrend continues.
Also, the performance of oscillators heavily depends on their settings. If the oscillator settings are not chosen correctly, the signals you receive may be completely useless.
Therefore, oscillators should be used alongside other technical analysis tools and should not be used alone for decision-making. Combining these tools with trend analysis, support and resistance lines, and price patterns can significantly increase the accuracy of your trades.
Oscillators in Trending and Ranging Markets: What's the Difference?

One of the key points in using oscillators is understanding the difference in their performance in trending and ranging markets. Depending on whether the market is in a trend (upward or downward) or ranging (without a clear trend), the way oscillators are used will differ.
Oscillators in Ranging Markets
In ranging markets, price fluctuates within a specific range and no specific direction can be determined for its movement. These conditions are particularly suitable for oscillators, as these tools can identify price reversal points with high accuracy. For example, if the price approaches the ceiling of the range and the oscillator enters the overbought area, the likelihood of a price reversal downward increases. Conversely, when the price approaches the floor of the range and the oscillator enters the oversold area, the likelihood of a price increase will be greater.
Using oscillators such as RSI and stochastic in ranging markets is very effective. These tools can help you find suitable points for entering and exiting trades without needing to analyze the trend.
Oscillators in Trending Markets
In trending markets, price consistently moves in a specific direction (upward or downward). In such conditions, using oscillators may be challenging, as these tools typically enter overbought or oversold areas too soon and provide false signals.
For example, in a strong uptrend, RSI may rise above 70 and enter the overbought area, but this does not mean that the trend has ended. In fact, in trending markets, it's better to use oscillators to identify corrective points in the direction of the trend, not to identify trend changes.
For this reason, in trending markets, combining oscillators with other tools such as trendlines or moving averages is usually recommended. This combination can help you avoid false signals and make better decisions.
How to Filter False Signals from Oscillators?
Oscillators are powerful tools for technical analysis, but like any other tool, they may provide false signals. These false signals can lead to incorrect trading decisions, especially when the market is in unusual conditions or when the oscillator is used alone. Therefore, filtering false signals is one of the most important skills that every trader must learn for effective use of oscillators.
Combining Oscillators with Other Technical Analysis Tools
One of the best methods for filtering false signals is combining oscillators with other technical analysis tools. For example, if the RSI oscillator shows that the price is in the overbought area, instead of immediately entering a sell trade, it's better to also check the price position relative to support and resistance lines. If the price is close to a strong resistance level, the likelihood of a price reversal is greater and the RSI signal will be more reliable. But if the price still has a considerable distance from the resistance level, the RSI signal may be premature and the uptrend may continue.
Using Multiple Oscillators Simultaneously
Another method for filtering false signals is using multiple oscillators simultaneously. For example, you can use a combination of RSI and stochastic. If both tools give similar signals (such as entering the overbought or oversold area), the likelihood of the signal being correct increases. But if one oscillator gives a buy signal and the other gives a sell signal, it's better to refrain from entering a trade until the signals become clearer.
Divergences
Divergences are also another important tool for filtering false signals. If the price is rising but the oscillator shows a downward trend, this divergence can be a sign of weakness in the uptrend and the possibility of a price reversal. Divergences are usually more reliable compared to regular oscillator signals and can help you prevent false signals.
Using Different Timeframes
Another effective strategy is using different timeframes. If an oscillator gives a sell signal in a short-term timeframe but still indicates an uptrend in a long-term timeframe, it's better not to trust the short-term signal. Examining multiple timeframes can help you have a bigger picture of the market and make more accurate decisions.
Finally, you should not forget that oscillators are complementary tools and should not be used alone for decision-making. Combining them with other tools such as price action, trading volume, trendlines, and moving averages can significantly increase the accuracy of your analysis. Also, always remember that no tool can be 100% accurate and risk management is one of the most important principles for success in trading.
Comparing Oscillators with Other Analysis Tools: Where to Use Which?
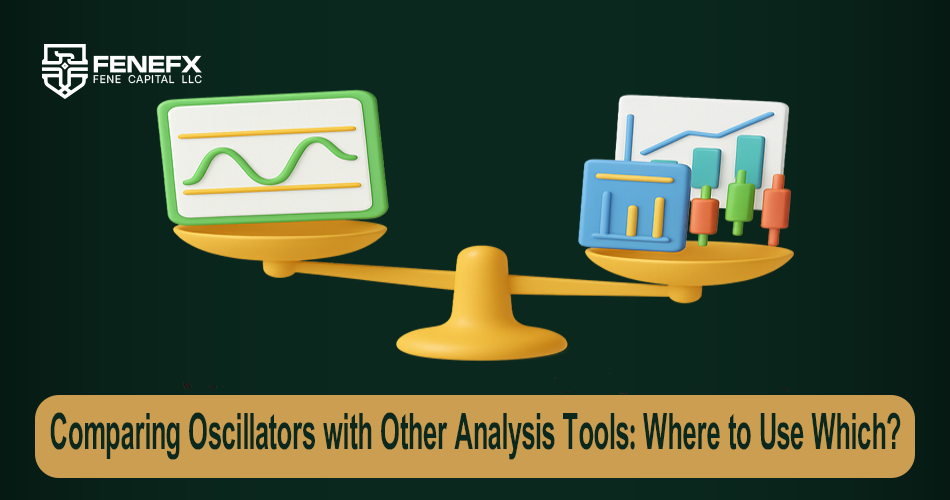
In the world of technical analysis, there are numerous tools for analyzing price movement, but choosing the best tool depends on market conditions and your trading strategy. Oscillators are one of these tools, but how can they be compared with other analysis tools and how do we know which one to use in what conditions?
Oscillators are specifically designed to identify price reversal points. These tools perform best when the market is in a ranging or trendless state. For example, in a ranging market, oscillators such as RSI or stochastic can help you identify overbought and oversold points and enter trades at the best possible time. This is while tools such as trendlines or moving averages typically perform better in trending markets.
In trending markets, using tools such as moving averages, trendlines, and chart patterns is recommended. These tools help you identify the general direction of price movement and conduct your trades in the direction of the trend. In such conditions, oscillators may provide false signals, as they typically enter overbought or oversold areas too soon. For example, in a strong uptrend, RSI may rise above 70 and indicate overbought conditions, but this does not necessarily mean a price reversal, as the uptrend may still continue.
One of the key differences between oscillators and other tools is that oscillators typically fluctuate within a specific range (such as 0 to 100), while other tools such as trendlines or price patterns are not limited to such a range. This feature allows oscillators to identify overbought and oversold conditions, but this same limitation can be problematic in trending markets.
For better combination of these tools, you can use oscillators as complementary tools alongside other tools. For example, if a moving average indicates that the market is in an uptrend, you can use oscillators to identify corrective points in the direction of the trend. Similarly, if support and resistance lines indicate a strong price range, oscillators can help you find more precise entry and exit points.
Ultimately, the choice between oscillators and other analysis tools depends on your trading strategy and market conditions. If the market is in a ranging state, oscillators are very useful tools. But in trending markets, it's better to use them as a complementary tool and make your decisions based on other tools such as trendlines or moving averages. Combining these tools can help you perform more accurate analyses and have more successful trades.
Comments
Worth emphasizing: in a strong trend an oscillator can stay overbought for weeks. Divergence is where these tools really shine, not the overbought/oversold levels alone.
Finally understand the difference between an indicator and an oscillator, I honestly thought they were the same thing. Thanks for keeping it simple!
When I started out I bought every RSI oversold signal and kept losing. Took me a year to realize oscillators need trend context. Good to see that warning included here.
RSI vs Stochastic — which one do you find more reliable for ranging markets? A practical comparison article would be awesome.
Nicely explained, zero fluff. Good stuff 👍