

What is Moving Average?
Moving Average is a set of technical analysis tools used to identify market trends and predict the direction of price movements in the market and forex trading. These tools help traders by calculating the average price over a specified time period, allowing them to filter out short term market fluctuations and get a clearer view of long term trends. In the complex world of financial markets, moving averages play an important role in determining entry and exit points for trades
Familiarity with the Principles and Applications of Moving Average in Technical Analysis
Principles and Applications of Moving Average in Technical Analysis:
Principles of Moving Average in Technical Analysis
Moving Average (MA) is considered one of the fundamental tools in technical analysis. The principle behind moving average is based on calculating the average price of an asset over a specific time period, clarifying market trends and reducing short term erroneous data.
The information from the moving average is displayed as a smooth line on the chart, allowing traders to easily identify major trends in the market while filtering out irrelevant and short term fluctuations.
Applications of Moving Average in Technical Analysis
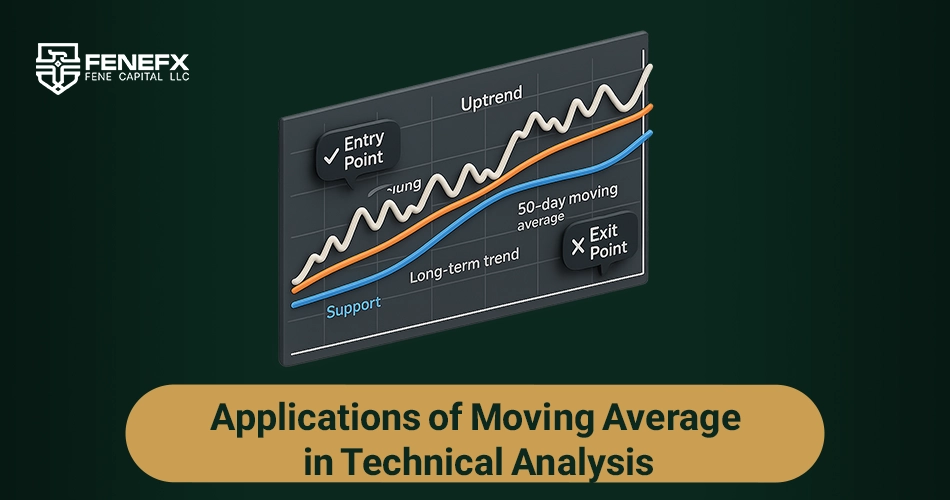
As mentioned, moving averages are among the most widely used tools in technical analysis. Therefore, it is not surprising that they are used to determine entry and exit points in the market, identify and forecast trend changes, apply in crossover strategies, filter market noise, detect support and resistance levels, identify changes in price direction, and simulate long term trends.
To better understand the applications of moving averages in technical analysis, consider the following example:
Suppose you are trading in the forex market and using moving averages for analysis. When the price crosses from below to above the 50 period moving average, this is an entry point for a buy trade, indicating the start of an uptrend.
At the same time, the 200 period moving average helps you simulate the long term market trend and determine whether the market is in an uptrend or downtrend. If the price consistently stays above this moving average, it means the market is in an uptrend.
Additionally, if the price crosses below the 50 period moving average from above, this could be an exit point from the trade, potentially signaling the start of a downtrend (a death cross).
On the other hand, you can also use these moving averages to identify support and resistance levels. For example, when the price approaches the moving average and then reverses, it could indicate a strong support or resistance level.
Types of Moving Averages
The types of Moving Average are as follows:
Simple Moving Average (SMA)
The Simple Moving Average (SMA) calculates the average of prices over a specified time period. For example, if you want to calculate the average price of a stock over a specific number of days, say five days, you would add the prices of the last five days and divide by the number of days. This type of moving average is simple and is mostly used to identify the overall market trend.
Exponential Moving Average (EMA)
The Exponential Moving Average (EMA) is similar to the Simple Moving Average, but it gives more weight to recent prices and responds more quickly to market changes. This feature makes it suitable for traders who react to rapid price changes. For example, if the price of a currency changes quickly, the Exponential Moving Average will react faster than the Simple Moving Average.
Weighted Moving Average (WMA)
The Weighted Moving Average (WMA) is similar to the Exponential Moving Average, but it assigns different weights to each price in a specific time period. This means that certain prices are given more importance than others. This type of moving average allows analysts to focus more on specific data for more precise analysis.
Moving Average Based Strategies
Review of Moving Average Based Strategies:
Crossover Strategy
This strategy uses the crossover of two moving averages with different time periods. When a short term moving average crosses from below to above a long term moving average, a buy signal is generated, and conversely, when a short term moving average crosses from above to below a long term moving average, a sell signal is created. This strategy is simple and reliable and is typically used to identify the main market trends.
Support and Resistance Points Strategy
In this strategy, moving averages act as dynamic support and resistance levels. When the price approaches a moving average, there is a likelihood that the price will reverse or stall at that point. For example, if the price approaches a moving average and then reverses, that level can be considered as a support or resistance area. This strategy is particularly effective in highly volatile markets.
Moving Average with Multiple Time Frames Strategy
This strategy involves using moving averages on different time frames to confirm signals. For example, a trader might use a short term moving average on a 15 minute time frame and a long term moving average on a 4 hour time frame to confirm signals that appear on shorter time frames with the long term trend. This method helps reduce false signals and improves the accuracy of trades.
Divergence Identification and Strategy
In this strategy, divergence between price and moving averages is used to identify trend reversal points. When the price moves upwards or downwards, but the moving average shows divergence (meaning the direction of price movement contradicts the direction of the moving average), it may indicate that the trend is reversing. This signal can be used to predict future price changes.
Moving Average in Different Time Frames: Choosing the Right Strategy for Accurate Market Analysis
Review of Moving Average in Different Time Frames:
Moving Average in Short Term Time Frames
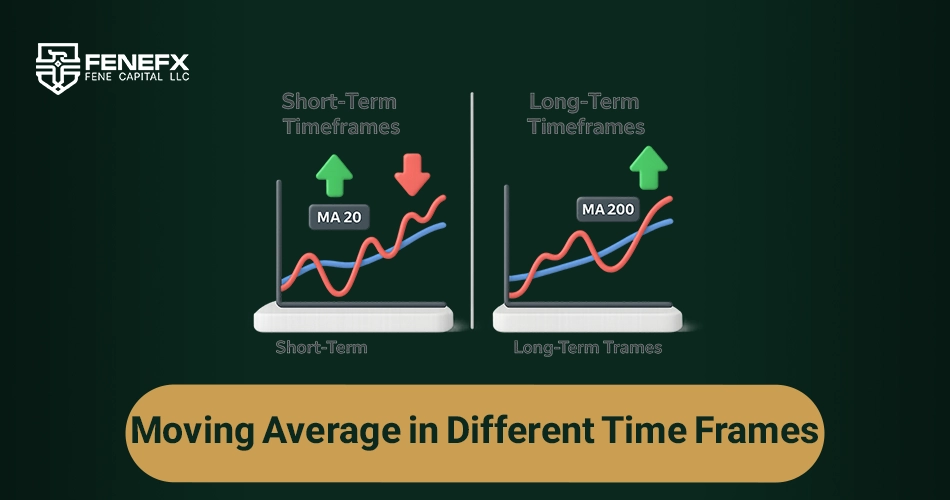
In short term time frames (such as 1 minute, 5 minute, or 15 minute), traders are more focused on identifying short term fluctuations and taking advantage of quick opportunities. In these time frames, short term moving averages (such as MA 5, MA 10, or MA 20) are typically used, as they react quickly to price changes. This tool is suitable for those interested in scalping strategies and quick trades.
Suitable Strategies for Short Term Time Frames
The strategy of Fast Moving Average Crossover: It involves using two short term moving averages, such as MA 5 and MA 20. When MA 5 crosses MA 20 from below upwards, it signals a buy, and vice versa for a sell. This strategy is used for quick and short term trades.
Breakout Strategy: In this strategy, moving averages are used as a filter to identify strong breakouts. When the price crosses above the short term moving average and a clear trend begins, the trader enters the trade.
Moving Averages in Long Term Timeframes
In long term timeframes (such as 1 hour, 4 hours, or daily), the focus is more on identifying the overall market trends. In these timeframes, long term moving averages (such as MA 50, MA 100, or MA 200) are typically used, and their signals are especially useful for traders looking for long term trades. These moving averages simulate large, directional market trends.
Long Term Timeframe Strategies
Long Term Moving Average Crossover Strategy:This strategy involves using two moving averages with different time periods (e.g., MA 50 and MA 200). A buy signal is generated when the short term moving average crosses the long term moving average from below upwards.
Using Moving Averages as Support and Resistance Strategy:In this strategy, long term moving averages act as support and resistance levels. If the price approaches these levels and a reversal occurs, it can signal the continuation of the trend.
Finally, as a final point, we can refer to the difference in time frames for moving averages by noting that moving averages are very useful in short term timeframes because they react quickly to price changes and help traders identify small market fluctuations. This feature is highly effective for swing trading strategies and fast trades.
However, in long term timeframes, short term moving averages can generate false signals. In these timeframes, the market moves in larger trends, and short term moving averages are influenced by small fluctuations, which results in false signals. To analyze long term trends, it is better to use long term moving averages.
Comments
The 200-day MA has talked me out of more bad longs than any mentor ever did. Learned that after buying 'dips' below it for a whole year.
Clean explanation, no jargon overload. Liked it.
Which period settings do you recommend for the 4H chart? An article on MA crossover strategies would be a nice follow-up.
Worth stressing that MAs lag by design. In ranging markets they'll chop you to pieces — I only lean on the 200 for trend context and use structure for actual entries.
The EMA vs SMA comparison finally made sense to me — I'd been using both interchangeably without knowing the difference. Thanks for keeping it simple.