

What is Fibonacci in Forex?
Fibonacci is one of the most widely used tools in technical analysis for Forex trading. It helps traders identify key entry and exit points, as well as support and resistance levels. According to statistics, more than 70% of professional traders use Fibonacci tools to accurately predict price movements. The tool is named after the Italian mathematician Leonardo Fibonacci, who introduced a famous sequence in the 13th century, which forms the foundation of Fibonacci tools in technical analysis today.
What is the Fibonacci Sequence?
The Fibonacci sequence consists of a series of numbers where each number is the sum of the two preceding ones: 0, 1, 1, 2, 3, 5, 8, 13, 21, 34, ...
One of the most important features of this sequence is the specific ratios derived from dividing these numbers. The key ratios used in technical analysis are: 23.6%, 38.2%, 50%, 61.8%, and 100%.
Application of Fibonacci in Forex Technical Analysis
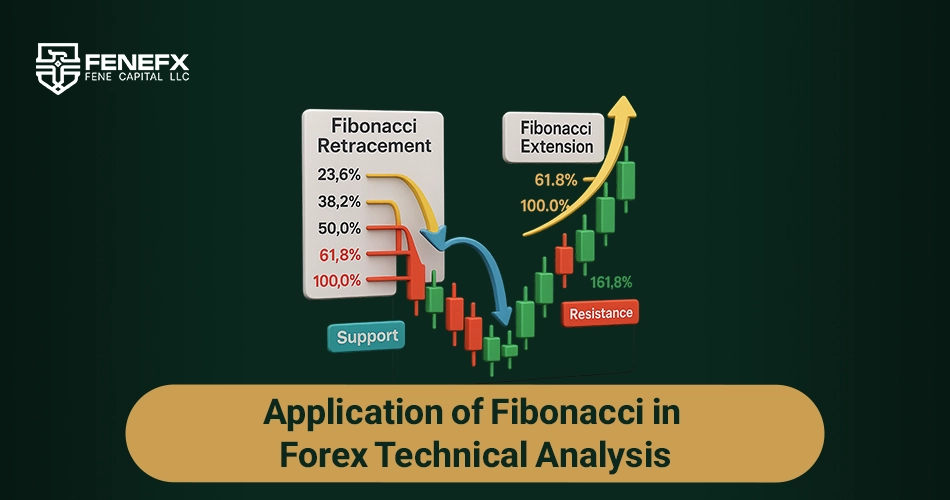
Fibonacci assists traders in identifying support and resistance levels, enabling them to devise precise entry and exit strategies for their trades. Below, we explore the two main Fibonacci tools used in Forex technical analysis:
1. Fibonacci Retracement
Fibonacci Retracement is utilized to identify levels where the price might pause or reverse after a sharp move (either upward or downward). This tool draws horizontal lines based on Fibonacci ratios to highlight key levels where price retracement is likely.
Primary Applications of Fibonacci Retracement:
- Identifying Entry Points:Traders often use this tool to locate points where the price is likely to resume its primary trend after a retracement.
- Predicting End of Retracement:Fibonacci retracement helps traders identify price levels where the correction might conclude.
- Risk Management:By determining potential support and resistance levels, traders can optimize their stop-loss and take-profit orders.
Key Fibonacci Retracement Levels:
- 23.6%:Minor retracement, typically observed in strong trends.
- 38.2% and 50%:Standard retracement levels, often signaling a pause before continuing the trend.
- 61.8%:The "golden level," historically and psychologically significant, often marking strong reversals.
- 100%:Full price retracement, indicating a potential trend reversal.
Practical Example:Suppose EUR/USD rises from 1.1000 to 1.2000 and then starts to pull back. Traders can draw Fibonacci retracement from 1.1000 (low) to 1.2000 (high). If the price halts near the 61.8% level (1.1500) and shows signs of reversal, traders might enter a long position.
2. Fibonacci Extension
Fibonacci Extension aids traders in identifying price targets during a trend continuation. This tool is typically used after a support or resistance level has been broken to predict where the price might pause or reverse.
Primary Applications of Fibonacci Extension:
- Setting Price Targets:After entering a trade, traders use Fibonacci extension levels to set profit targets.
- Identifying New Support or Resistance:This tool helps pinpoint potential zones where the price might encounter new resistance or support.
Key Fibonacci Extension Levels:
- 61.8%:An initial target indicating moderate price expansion.
- 100%:The primary target for complete price extension.
- 161.8%:Often used as a secondary target in strong trends.
- 261.8% and Above:Advanced levels typically seen in highly volatile markets.
Practical Example:Imagine the price of gold rises from $1800 to $1900 and then retraces to $1850. Traders can use Fibonacci extension to identify new price targets as the trend resumes. If the price breaks above $1900, levels like 161.8% ($1950) and 261.8% ($2000) might serve as subsequent targets.
By integrating these tools, traders can effectively anticipate market movements, optimize their strategies, and enhance their decision-making in Forex trading.
Comparison of Fibonacci Retracement and Extension
In the table below, all aspects of Fibonacci Retracement and Extension are compared.
Fibonacci Extension | Fibonacci Retracement | Feature |
| Setting price targets in continued trends | Identifying price correction levels | Primary Purpose |
61.8%, 100%, 161.8%, 261.8% | 23.6%, 38.2%, 50%, 61.8%, 100% | Key Levels |
Predicting price movement beyond previous levels | Determining the end of corrections | Usage |
Why is Fibonacci Effective in Forex?
- Psychological Behavior of Traders:Fibonacci ratios are highly effective in financial markets due to their strong psychological influence on traders. These levels often act as self-fulfilling prophecies as traders collectively anticipate price reactions around them.
- Compatibility with Strong Trends:Fibonacci tools align well with strong bullish or bearish trends, helping traders identify potential reversal points or continuation zones within the trend.
- Integration with Other Tools:Fibonacci can be combined with tools like trendlines, moving averages, and other indicators to enhance the accuracy of analysis and strengthen decision-making.
Both Fibonacci Retracement and Extension are powerful tools in Forex technical analysis. They assist traders in predicting price movements and crafting more effective strategies. Utilizing these tools in combination with proper risk management and other analytical methods can significantly improve trading performance and profitability.
How to Use Fibonacci in Forex Trading?
To effectively utilize Fibonacci tools, traders should follow several essential steps and combine them with other analytical methods. Below is a comprehensive guide:
1. Identify the Primary Market Trend
The first and most crucial step is identifying the primary trend in the market, which can be either bullish or bearish. This helps traders apply Fibonacci tools correctly.
- Steps to Identify Trends:
- Uptrend:Prices consistently form higher highs and higher lows.
- Downtrend:Prices consistently form lower highs and lower lows.
- How to Draw Fibonacci Levels:
- In an Uptrend:Draw Fibonacci from the lowest point (Low) to the highest point (High).
- In a Downtrend:Draw Fibonacci from the highest point (High) to the lowest point (Low).
This mapping highlights Fibonacci levels on the chart, indicating potential reversal or continuation points.
2. Using Fibonacci Levels for Trade Entry Points
After plotting Fibonacci levels, traders can use them to identify entry points. If the price nears a Fibonacci retracement level and shows signs of reversal, it may present a good opportunity to enter a trade.
- How to Identify Entry Points:
- Observe Price Behavior:When the price nears key Fibonacci levels (e.g., 38.2% or 61.8%), monitor its behavior. If it begins to reverse, the level may act as support or resistance.
- Candlestick Reversal Patterns:Patterns like Pin Bar, Hammer, or Shooting Star indicate potential reversals.
- Confluence with Other Tools:If a Fibonacci level aligns with a trendline, moving average, or significant support/resistance, it increases the likelihood of a reversal.
Example:
Suppose EUR/USD is in an uptrend from 1.1000 to 1.2000. If the price retraces to the 61.8% level (1.1500) and forms a strong bullish candle, this could be a suitable point to enter a buy trade.
3. Setting Stop Loss and Take Profit
Risk management is a fundamental principle of successful trading. Fibonacci levels can help traders define stop-loss and take-profit points.
- Setting Stop Loss:
- For buy trades: Place the stop-loss slightly below the Fibonacci retracement level used for the trade.
- For sell trades: Place the stop-loss slightly above the Fibonacci retracement level used for the trade.
- Setting Take Profit:
- Use Fibonacci extension levels (e.g., 100%, 161.8%, and 261.8%) to define profit targets.
Example:
If a buy trade is entered at the 61.8% retracement level, place the stop-loss near the 78.6% level and set the take-profit at the 161.8% extension level.
4. Combining Fibonacci with Other Tools
While Fibonacci is powerful on its own, combining it with other technical tools can enhance accuracy.
- Helpful Tools to Combine with Fibonacci:
- RSI (Relative Strength Index):When RSI shows overbought or oversold conditions near a Fibonacci level, it provides stronger confirmation.
- MACD (Moving Average Convergence Divergence):MACD crossovers or histogram shifts that align with Fibonacci levels can validate entry or exit points.
- Trendlines:If a Fibonacci level coincides with a trendline, it indicates strong support or resistance.
- Price Patterns:Patterns like Double Tops or Head and Shoulders can complement Fibonacci analysis.
5. Continuous Monitoring and Revision
Financial markets are dynamic, and changing conditions can significantly impact Fibonacci levels. Regularly reviewing price movements and revising analysis is essential.
- Key Monitoring Tips:
- If a Fibonacci level is broken, update your analysis to identify new levels.
- Pay attention to trading volume; higher volume near Fibonacci levels often confirms their significance.
- Use historical data and past price behavior to make more accurate predictions.
Using Fibonacci in Forex trading requires a solid understanding of market trends, precise identification of reversal points, and effective risk management. By integrating Fibonacci with other tools and adhering to sound money management principles, traders can create better trading strategies and improve their success rate. Consistent practice and thorough market analysis are critical to maximizing the potential of this powerful tool.
Advantages and Disadvantages of Using Fibonacci in Forex
Like any other tool, Fibonacci has its own set of advantages and disadvantages. Traders should be aware of these to optimize their analysis.
Advantages
- Simple and Practical:The Fibonacci tool is easily accessible on most trading platforms.
- Helps Identify Key Levels:It assists traders in pinpointing critical market levels.
- Highly Versatile:Fibonacci can be combined with other tools and strategies for enhanced accuracy.
Disadvantages
- Affected by Market Conditions:Fibonacci levels may not work as effectively in highly volatile markets.
- Subjectivity in Drawing:Selecting the start and end points can vary from trader to trader.
- Requires Confirmation:Fibonacci alone is insufficient and needs validation from other tools.
Practical Example of Using Fibonacci in Forex
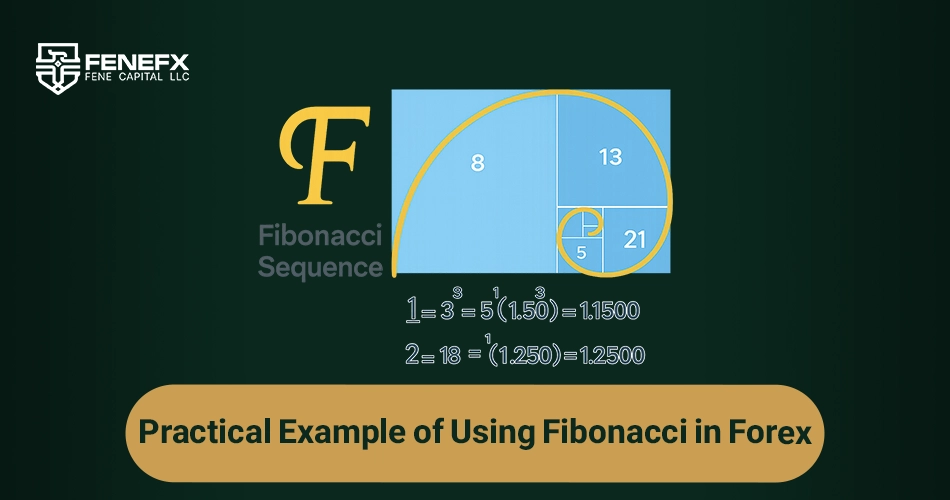
Suppose the EUR/USD price has moved upward in a bullish trend from 1.1000 to 1.2000 and then starts to correct:
- Drawing Fibonacci Retracement:Apply the Fibonacci tool from 1.1000 (Low) to 1.2000 (High).
- Identifying Key Levels:If the price retraces to the 61.8% level (1.1500) and shows signs of reversal, this level can present a buying opportunity.
- Setting Price Target:Use Fibonacci Extension levels to set a price target at the 161.8% level (1.2500).
Fibonacci is one of the most powerful technical analysis tools in Forex, helping traders identify key market levels, such as support and resistance. Based on the Fibonacci mathematical sequence and its derived ratios, this tool is particularly effective in predicting price retracements and extensions in financial markets.
Using Fibonacci involves identifying the main trend, accurately drawing retracement and extension levels, and combining it with other tools such as trendlines, moving averages, and technical indicators.
This approach enables traders to find optimal entry and exit points while managing trade risks effectively.
However, like any other tool, Fibonacci has its limitations, including sensitivity to market conditions and the subjective nature of drawing levels. Traders must use it with precision, flexibility, and in conjunction with other tools to enhance their analyses and improve trading performance.
Comments
Best fib intro I've read, honestly.
Always wondered why everyone on trading Twitter talks about 0.618 like it's magic. This finally explained where those numbers actually come from, thanks!
Fib levels work best as confluence, not standalone signals. A 61.8 sitting on a prior daily level and a round number — that's a trade. A fib alone is just a line on a chart.
How do you choose which swing high and low to anchor the retracement on? That's where I always mess up. A dedicated article on anchoring would be gold.
I ignored fibs for years thinking they were astrology for traders. Then I started marking the 61.8 on my gold setups and... okay, I get it now. Price respects it weirdly often.