


What is Multi Time Frame Analysis?
In simple terms, multi time frame analysis means examining a chart across multiple time frames to achieve a more accurate and comprehensive analysis. In fact, when a trader operates only on a single time frame such as the 15 minute or 4 hour chart they have a limited perspective on market behavior. Multi time frame analysis helps by first understanding the bigger picture of the market on a higher time frame, then reviewing the market structure in the medium term, and finally, using the lower time frame for precise entry and exit decisions.
Imagine a trader receives a buy signal on the 5 minute time frame, but upon examining the daily chart, it becomes clear that the market is in a strong downtrend. In this case, relying solely on the 5 minute time frame may lead to a decision that is inconsistent with the broader market structure. Multi time frame analysis prevents such errors by aligning trading decisions with multiple layers of information.
This analytical method can be applied to all trading styles from scalping to swing trading provided that appropriate time frames are chosen for each style. For example, a medium term trader may analyze the daily time frame for trend direction, the 4 hour time frame for market structure, and the 30 minute time frame for entry points.
Why Should We Use Multi Time Frame Analysis?
Multi time frame analysis is not a decorative technique but a real necessity for professional decision making in the market. Financial markets move simultaneously across multiple time layers. It is possible that a symbol shows an uptrend on the 1 hour time frame, while the same symbol is undergoing a bearish correction on the daily time frame. If a trader limits themselves to only one time frame, they will miss this difference and may trade against the dominant market flow.
One of the main reasons for using multi time frame analysis is to avoid entering at wrong points. When the overall market direction is identified on a higher time frame, only signals from the lower time frame that align with that trend should be taken. This significantly increases the probability of successful trades.
Additionally, multi time frame analysis helps traders avoid falling into the trap of price noise on lower time frames. Especially in markets like Forex, where rapid and deceptive moves on lower time frames are frequent, relying solely on one chart can lead to false signals.
Moreover, using higher time frames to identify key support and resistance zones, reversal points, and trend lines is much more accurate and reliable. Once these zones are identified on higher time frames, they can be traded on lower time frames with greater confidence.
Ultimately, a trader using multi time frame analysis achieves a layered and multidimensional understanding of the market. This combined perspective allows not only better entry points but also timely exits. This approach transforms the trader from a reactive participant into an active analyst.
Advantages of Multi Time Frame Analysis Compared to Single Time Frame Analysis
Analyzing a single time frame, although simpler, gives the trader a limited perspective. In contrast, multi time frame analysis allows the trader to see the market both from above (like a bird with a panoramic view from the sky) and up close to examine the details of movements.
Improved Timing of Entry and Exit
The first advantage is improved timing of entry and exit. Suppose the daily time frame shows an uptrend but the price has entered a correction phase. If you observe in the 1 hour time frame that the correction is ending and reversal candles are appearing, this combination is a strong signal for entry.
Filtering False Signals
The second advantage is filtering out false signals. On lower time frames, price volatility is high and many indicators give deceptive signals. However, if these signals are confirmed by the structure or trend on a higher time frame, their validity increases and the success rate improves.
Better Understanding of Market Structural Behavior
The third advantage is a better understanding of the market’s structural behavior. Trends, corrections, breakouts, and pullbacks form on higher time frames, while lower time frames only reflect their details. Therefore, if a trader relies solely on a lower time frame, they may misinterpret the market’s behavior.
For example, a bullish breakout may occur on the 5 minute chart, but on the 4 hour chart, that same point might be only the shadow of a bearish candle. This is where single time frame analysis can mislead the trader and cause entries against the overall structure.
Here is a summary table comparing Single Time Frame Analysis and Multi Time Frame Analysis
| Analysis Feature | Single Time Frame Analysis | Multi Time Frame Analysis |
| Structural Perspective | Limited | Complete and Layered |
| False Signal Filtering | Weak | Strong |
| Entry and Exit Timing | Approximate | Precise |
| Overall Trend Analysis | Incomplete | Reliable |
| Suitable for New Traders | Yes, but Risky | Yes, with Proper Training |
In the end, if used correctly and logically, multi time frame analysis is not only uncomplicated but also clarifies the path to success in the market. For novice traders, learning this skill can be the difference between random trades and analytical decisions.
Is Multi Time Frame Analysis Really Reliable?
One of the fundamental questions for beginner traders is whether multi time frame analysis truly leads to better trading decisions or if it is just a complicated and time consuming technique. The answer, in one word, is “yes.” However, this is conditional on the analysis being executed properly and within a clear structure.
Multi time frame analysis is like looking at a map at different scales. When you only see the short time frame, it’s like using a magnifying glass on a map. You see the details but lose the bigger picture. Conversely, the higher time frame is like a satellite view. It shows the full image but lacks precise details. It is the combination of these two perspectives that makes accurate and consistent decisions possible.
Observing the performance of many professional traders and even advanced trading algorithms shows that multi time frame analysis lies at the heart of successful systems. This is because an entry point gains real strength when it aligns with the market structure on a higher time frame.
Of course, trusting this type of analysis makes sense only if the trader has a defined framework for reviewing time frames. Entering multiple time frames without logic may have the opposite effect and cause confusion. Therefore, selecting the base time frame, structural time frame, and entry time frame must be done carefully and suited to the trading style.
Overall, multi time frame analysis is not only reliable but also the fundamental method that saves the trader from emotional trading traps and guides them toward analysis based decisions.
What Tools Do We Need for Multi Time Frame Analysis?

To properly perform multi time frame analysis, no special or complex tools are required, but having certain features in your trading platform and the skill to use them is essential. Here are the main tools needed for this analysis:
Trading Platform with Multi Time Frame Capability
The primary requirement is access to a platform that allows opening charts simultaneously in different time frames. MetaTrader (MT4/MT5), TradingView, cTrader, and NinjaTrader all have this capability. On these platforms, you can open, for example, the daily, 4 hour, and 1 hour charts of a symbol simultaneously and compare its behavior.
Ability to Mark Structure on the Higher Time Frame
Before moving to lower time frames, you must be able to identify important areas on the higher time frame such as swing highs and lows, supply and demand zones, key support and resistance levels, and the overall market structure (uptrend, downtrend, range). Tools like horizontal lines, trendlines, rectangles, and Fibonacci tools are very useful at this stage.
Indicators That Are Meaningful Across Different Time Frames
Some indicators, such as Moving Averages, Ichimoku, RSI, and MACD, are useful on higher time frames for determining the trend and on lower time frames for generating entry signals. Therefore, understanding how indicators perform across different time frames is very important.
A Clear Mental and Analytical Framework
The final tool is not software but mental. The trader must have the ability to analyze multiple time frames simultaneously. This skill develops with practice, but having an analytical checklist, recording past trades, and practicing on historical charts facilitates the learning process.
In a simple summary: if you can select one time frame for the overall direction, one time frame for structure, and one time frame for the trigger (entry), and mark important zones using simple charting tools, you have the necessary tools for multi time frame analysis.
A Practical Multi Time Frame Analysis Strategy for Beginners
To better understand how to practically use multi time frame analysis, this section introduces a simple, effective, and fully executable strategy for novice traders. This strategy is based on three time frames: Daily for identifying the overall trend, 1 hour (H1) for structure and price zones, and 15 minutes (M15) for precise entry.
Step 1: Identify the Main Trend on the Daily Time Frame
Open the chart on the daily time frame. Look to determine the main trend. If highs and lows are rising, the trend is bullish. If they are falling, the trend is bearish. If the structure is unclear, the market is ranging or sideways, and it is better to avoid trading.
Step 2: Examine Structure on the H1 Time Frame
On the 1 hour time frame, look for areas where the price has reacted, such as supports and resistances, breakouts, and pullbacks. Also, observe the key daily zones on this time frame and consider the wave structure of the price. Has the price recently exited a correction? Has it reacted to daily support?
Step 3: Entry on the 15 Minute Time Frame
In the 15 minute time frame, look for entry confirmation. This confirmation can be a reversal candlestick pattern, a breakout of an internal trendline, a moving average crossover, or any trigger compatible with your strategy. The stop loss should be placed behind the last structural zone on the entry time frame, and the target should be the nearest resistance (in an uptrend) or support (in a downtrend) on the H1 time frame.
Real Example
| Time Frame | Role | Analysis |
| Daily | Trend Identification | Uptrend, Price correction in progress |
| H1 | Structure | Price has reacted to a key support level |
| M15 | Entry | Bullish candlestick pattern at support and breakout of internal trendline |
This strategy offers many advantages for beginner traders:
- It takes the big picture of the market into account
- It precisely identifies the entry point
- It has a logical structure for entry, stop loss, and target
The most important point in implementing this strategy is consistency in execution and avoiding constant switching between time frames. Using this approach alongside risk management can be one of the fundamental yet highly effective methods to start trading with multi time frame analysis.
Common Mistakes in Multi Time Frame Analysis
Although multi time frame analysis is a powerful tool for precise decision making in financial markets, improper use can lead to confusion and even increase errors in trading. Many beginner traders fall into avoidable mistakes due to unfamiliarity with the structure of this analysis.
Overusing Too Many Time Frames
The first and perhaps most common mistake is overusing multiple time frames. Some traders believe that the more time frames they analyze, the more accurate their analysis will be. However, this approach actually causes loss of focus and conflicting signals. Reviewing two or three targeted time frames (for example, daily, 4 hour, and 15 minute) is completely sufficient.
Lack of Logical Order in Reviewing Time Frames
The second mistake is not following a logical order when analyzing time frames. Some traders start with the lower time frame and then check the higher ones, while the correct sequence is from top to bottom. That is, first the market direction should be identified on the long term time frame, then the medium term for structure, and finally the short term for entry.
Excessive Contradiction Resolution Between Time Frames
Another mistake is excessive efforts to resolve contradictions between time frames. Sometimes the market is bullish on the higher time frame but a bearish signal appears on the lower time frame. In such cases, some traders try to eliminate this contradiction with additional analysis, whereas the simplest approach is to wait for the structures to align.
Also, some traders, without a deep understanding of price action structure, rely solely on indicator signals and assume that if the RSI is overbought on the higher time frame and crosses on the lower time frame, they must enter a trade. This overly mechanical approach causes analysis to be driven by superficial algorithms rather than logic.
Finally, one important mistake is failing to record and review past multi time frame analyses. Traders who do not evaluate their performance cannot understand where their analysis was correct and where errors occurred.
Where to Start with Multi Time Frame Analysis?
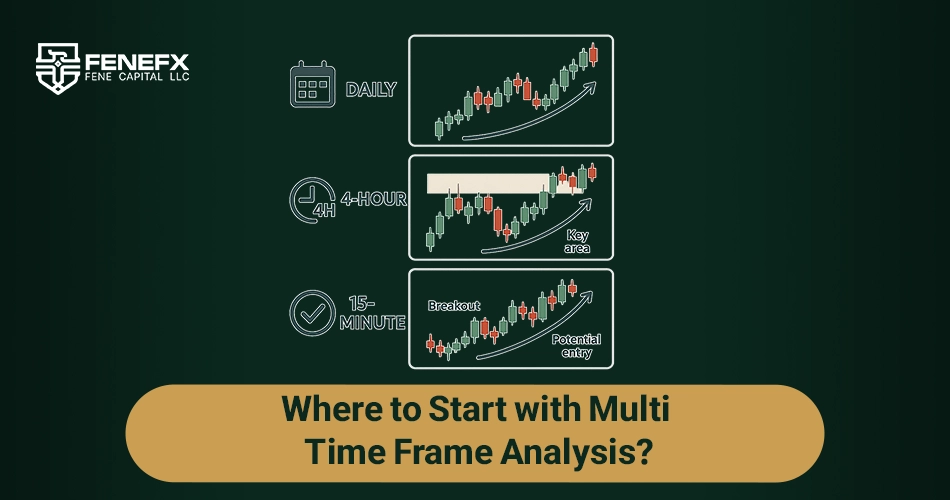
For beginner traders who have so far traded using only one time frame, entering the world of multi time frame analysis may seem complicated. However, with a clear step by step approach, this process can become completely simple and manageable.
The first step is to select three specific time frames. A simple and tested recommendation for novice traders is:
- Daily time frame (Daily) for analyzing the overall trend
- 4 hour time frame (H4) for structure and key zones
- 15 minute time frame (M15) for entry and position management
This combination provides both a big picture of the market and enough detail for proper entries. The key point in this selection is maintaining a logical ratio between time frames. Generally, the time frames should be approximately three to five times apart from each other.
Creating a Simple Analytical Checklist
The next step is to create a simple analytical checklist. In each analysis, first go to the higher time frame and ask yourself the following questions:
- What is the main trend?
- Is the market in a correction or continuing the trend?
- Which support or resistance zones are important?
Then, on the middle time frame, examine the market’s structural movements:
- Is the price forming a new low or high?
- Where have reliable breakouts and pullbacks occurred?
- Are the higher time frame zones confirmed?
Determining the Entry Point
Finally, on the lower time frame, find the entry point based on specific triggers. This trigger can be a reversal candlestick, a trendline breakout, a moving average crossover, or even a defined price action setup.
Alongside this process, practicing with historical charts, writing daily analyses, and even saving images of setups helps train your mind over time. Trading in the market is like building muscle; consistent practice and feedback are more important than memorizing patterns.
Multi time frame analysis should be seen as a new language. At first, you may not understand the connection between time frames, but over time, patterns and alignments will become clear. If you start with a simple structure, maintain your focus, and instead of jumping from one method to another, develop a deeper understanding of price movements, this analysis will soon become one of your main tools for success in the market.
Comments
Switched to a daily-4H-1H top-down about a year ago and my counter-trend losses dropped noticeably. Wish someone had drilled this into me earlier.
How do you handle it when the daily and 4H are pointing in opposite directions? Would love an article just on resolving timeframe conflicts.
Good stuff. My only pushback: more timeframes isn't always better. Two or three max, with a fixed ratio between them like 1:4 or 1:6, otherwise you just end up finding whatever bias you want.
One of the better MTF write-ups out there.
The top-down approach section cleared up something I'd been stuck on for weeks — I was doing it backwards, starting from the 5min. Thanks!