





Weekly Outlook in the Financial Markets
Following the recent FOMC meeting, the intermarket picture is rapidly reshaping. The US dollar has staged a V-shaped rebound from its lows, gold despite a stronger dollar remains on an upward track and is even showing signs of a potential blowoff phase. In contrast, Bitcoin has entered a corrective (rest) phase after its policy driven rally, while crude oil has returned to higher levels amid geopolitical narratives and strong US data. The main text places the five pillars of the market dollar, gold, crypto, equities, and oil side by side to assess capital flows, key technical levels, and “driving narratives” all at once. The goal is to go beyond a one dimensional view and capture the combined impact of forces shaping prices, from bond yields and the Federal Reserve’s tone to crypto on chain cycles and the swift rotation of risk appetite in commodities.
US Dollar: A Strong Rebound After the FOMC
The US dollar has been steadily rising from its pre-FOMC lows. Powell’s speech last week, which was not particularly dovish, triggered a sharp V-shaped rebound following the steep drop ahead of the meeting. Despite Powell’s reappearance at a conference in Rhode Island on Tuesday where his strong emphasis on employment could have been interpreted as dovish the markets barely reacted. On the contrary, the Dollar Index (DXY) closed higher the same day, signaling that markets had already priced in Powell’s remarks and were now looking for fresh catalysts.
Thursday’s decisive move was fueled by a combination of stronger than expected jobless claims data and higher Q2 GDP growth factors traders interpreted as justification to continue buying the dollar. The dollar gained about 0.40% on Thursday and reclaimed a critical pivot level that had previously capped its upward momentum.
From a technical perspective, several signals suggest a potential trend reversal. The key question now is whether this shift is temporary or the beginning of a new trend. The “double bottom” pattern formed just before last week’s FOMC meeting now serves as a solid base. Meanwhile, the geopolitical backdrop remains somewhat tense. Nothing major has yet occurred, but Eastern European countries continue to report threats from Russia. In addition, US Secretary of War (formerly Secretary of Defense) Pete Hegseth has called all generals for a meeting next week. Whether this is purely operational or a potential political obstacle, it nonetheless adds a layer of uncertainty to the markets, potentially boosting demand for the dollar.
Overall, the dollar’s upward momentum is reshaping market flows. Looking at charts covering the first three quarters of the year, any continued rally could significantly alter the broader direction of financial markets.
Treasury Yields and the Federal Reserve’s Stance
The yield on the US 2-year Treasury note has reacted to the 3.50% level following the FOMC meeting and now stands more than 10 basis points above its pre FOMC Wednesday level. The fact that recent lows (3.45%) have not been breached has created a positive outlook. Recent data has also eased concerns about the labor market, suggesting that the need for interest rate cuts now appears less urgent.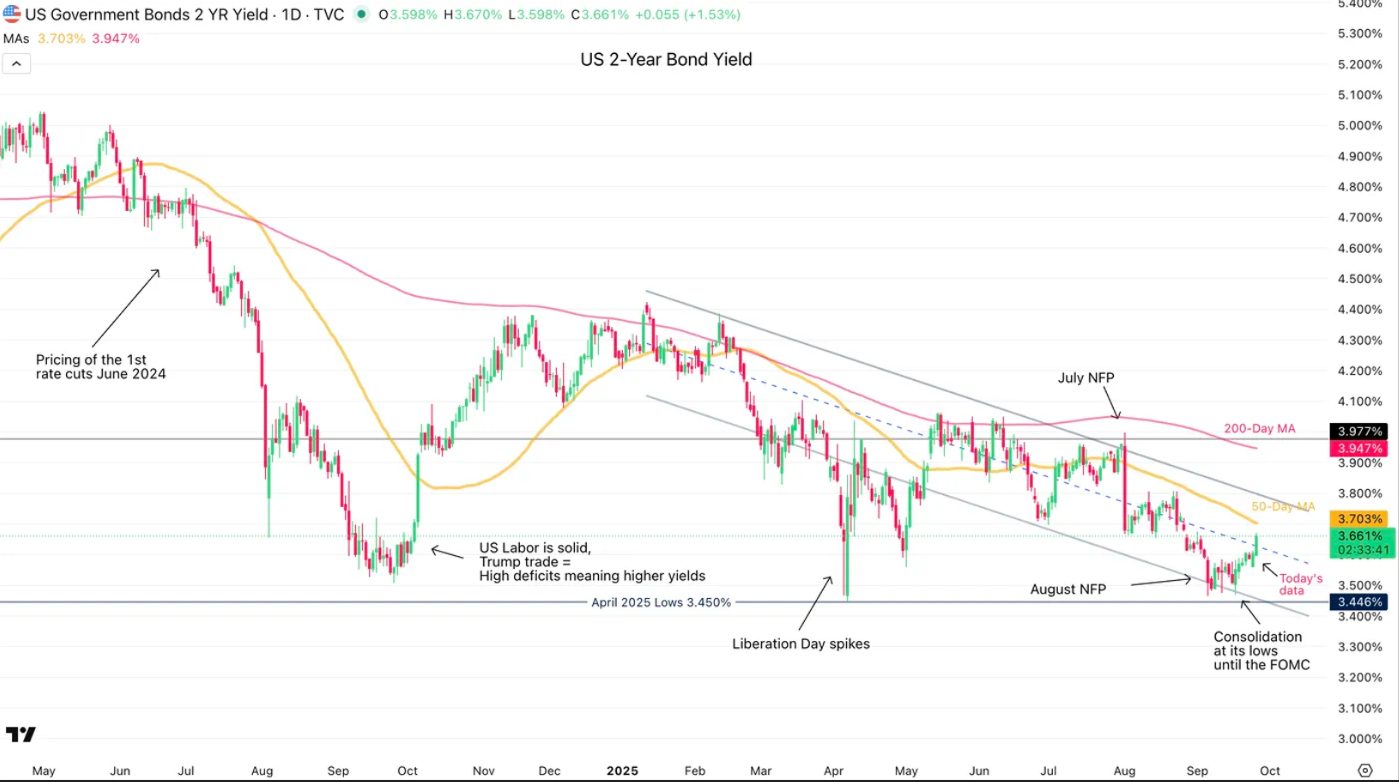
Rising Treasury yields have further boosted the appeal of the US dollar, but the story is more complex than that. Some analysts believe that the United States’ deep budget deficits will prevent the economy from slowing down.
This is why Federal Reserve officials continually emphasize that their decisions are “data dependent” a stance that has strengthened market confidence in the Fed’s independence and, in turn, increased demand for the dollar.
Dollar Technical Charts
Daily Chart of the DXY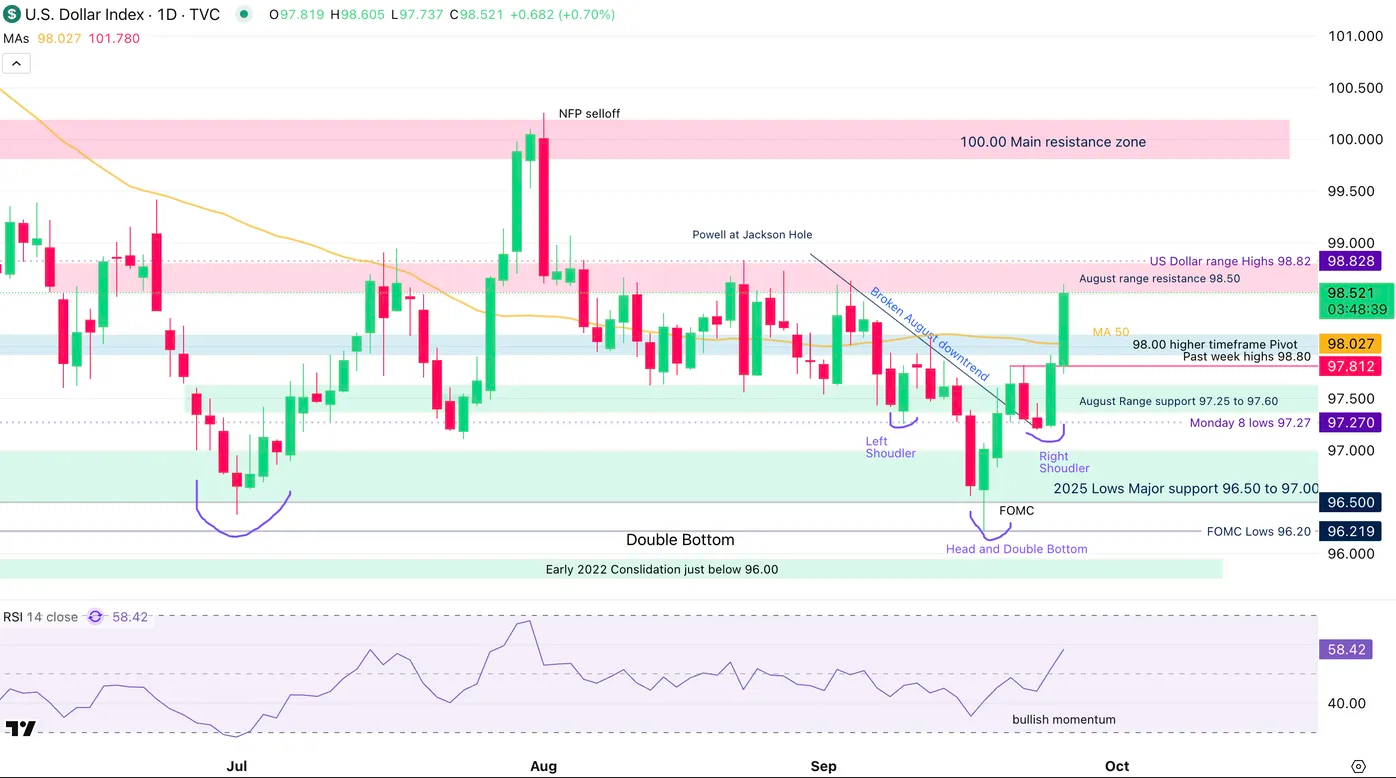
- After forming a double bottom at the 96.20 level (the lowest price of 2025), the Dollar Index has gained more than 2.42%.
- Today’s strong performance (+0.70%) broke through previous highs and is now testing the August 1 level.
- A “head and shoulders” pattern is in the process of completing, which if confirmed could activate higher targets.
4 Hour Chart of the DXY
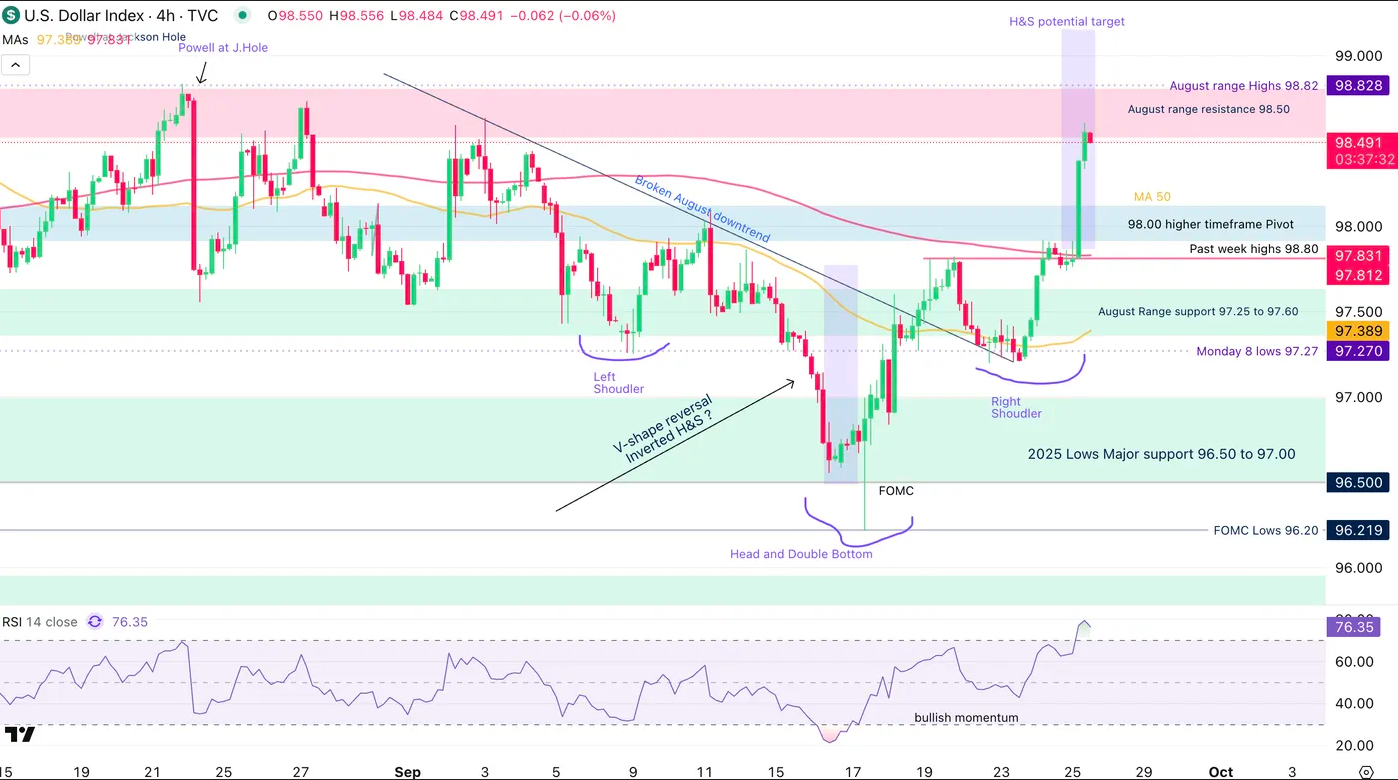
- Prices broke the August downtrend and, after a pullback, jumped in today’s session.
- The return to the moving averages has created breathing space for the dollar’s upside.
- If consolidation holds at current levels, the likelihood of a bullish breakout increases, with the 99.25 target (the head and shoulders objective) or even higher levels becoming likely.
Gold Enters an Explosive Phase: Breaking Above $3,800 with a $5,000 Outlook
The gold market once again demonstrated its exceptional strength last week. Trading began around $3,687 and, after breaking through the psychological barrier of $3,700, embarked on a fresh upward path. Short term fluctuations between $3,718 and $3,790 repeatedly triggered profit taking, but despite selling pressure, gold managed to hold its ground and ultimately closed the week near $3,765.
This resilience came at a time when the US dollar strengthened and economic data exceeded expectations clear signs of strong investor appetite for gold.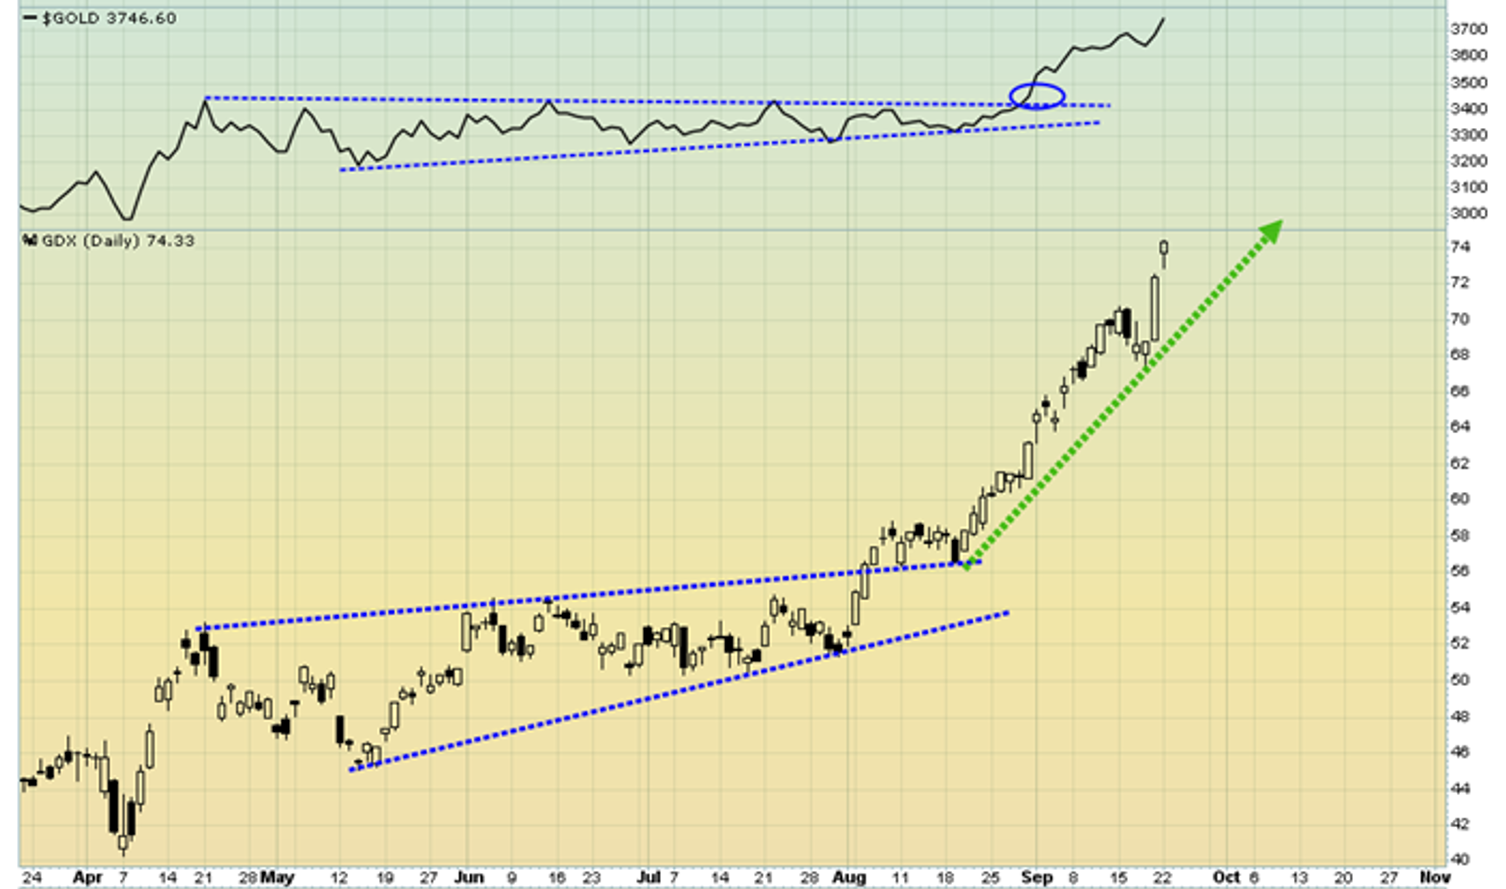
On the broader view, the weekly gold chart has nearly reached the $3,800 target, and the market is now entering a blowoff phase. In this stage, prices extend beyond technical targets. Analysts believe that reaching $4,000 in the short term and even $5,000 by the end of October is not unrealistic, as daily jumps of $100 to $300 become increasingly possible under such conditions.
Silver, meanwhile, is preparing to break above the $50 mark with a large inverted head and shoulders pattern. At the same time, the Federal Reserve’s short term rate cuts, coupled with rising long term yields, are undermining confidence in fiat currencies and fueling a fresh wave of demand for precious metals. Renewed interest from Indian investors and consistent central bank purchases further reinforce this explosive scenario.
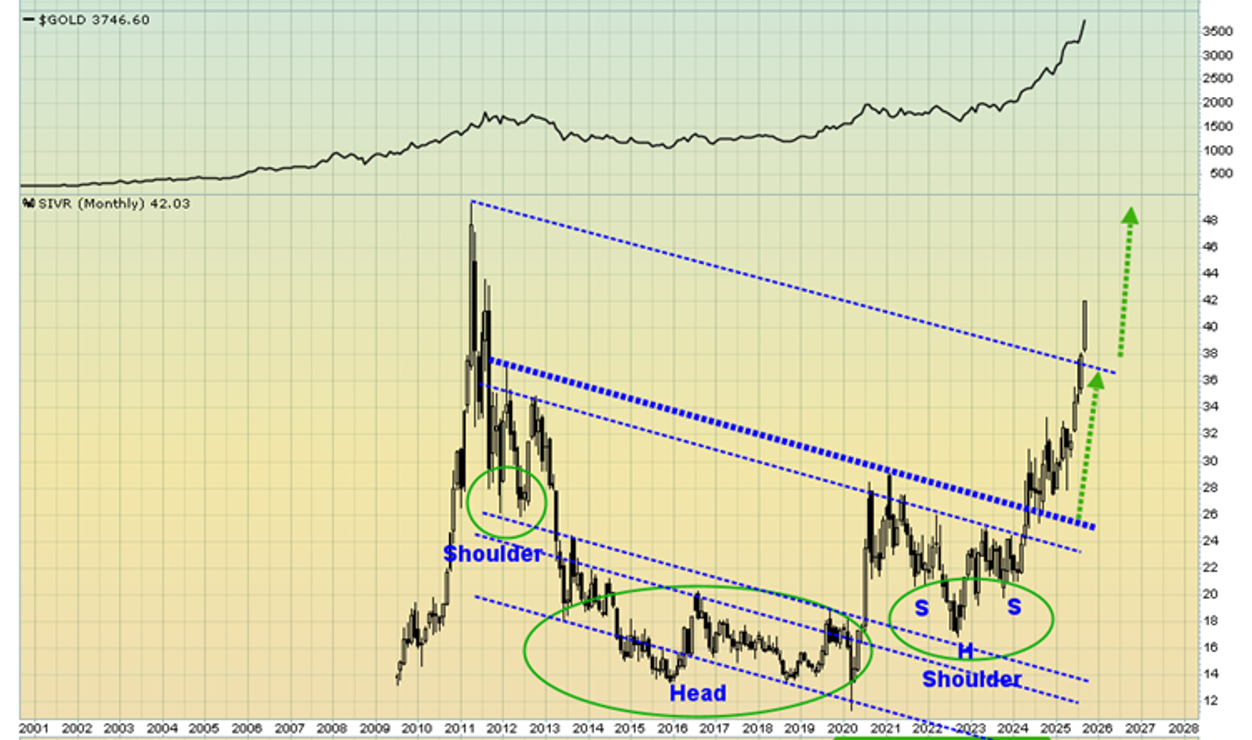
Expert views are aligned with this trend. A Kitco survey shows that 84% of Wall Street analysts expect gold to rise, with none projecting a bearish outlook. Strategists emphasize that even if the market undergoes a correction, such pullbacks will be brief and present fresh opportunities for buyers. This is especially true as the technical structure remains in favor of the bulls, with each breakout above key resistance levels producing multi hundred dollar surges. Meanwhile, mining stocks have also turned into money making machines alongside gold’s rally, and will become even more profitable at higher prices. In short, the market has entered a stage that many describe as the beginning of a “golden era” led by China and India, an era that could last for years.
Bitcoin and the Crypto Market: How Long Will the Correction Last?
Bitcoin, after its rally triggered by the FOMC meeting, is showing signs of exhaustion and has corrected about 8% from the $124,000 peak to around $113,700. In this phase, the classic “buy the rumor, sell the news” pattern is evident. The key cost basis for short term holders, around $111,000–$112,000, serves as a critical threshold to prevent the correction from deepening. Although the correction is milder compared to previous cycles, upward momentum has clearly weakened.
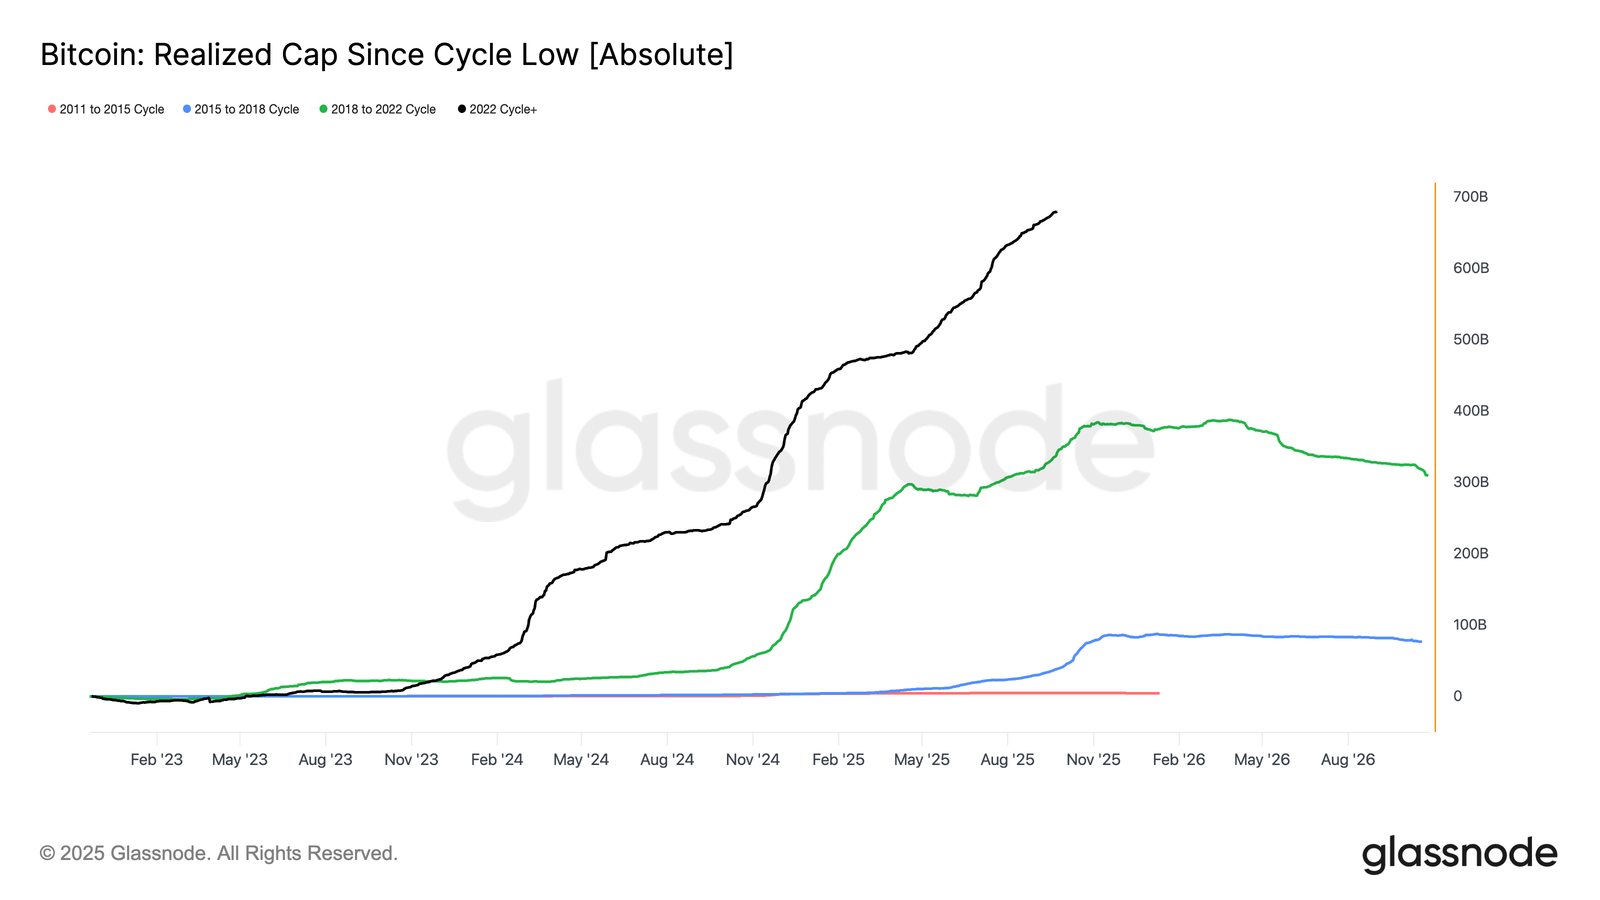
On the on-chain side, the scale of capital rotation has been unprecedented: $678 billion has been added to realized capitalization (Realized Cap), while long term holders have realized profits on 3.4 million BTC so far, a behavior typically seen near cycle tops. This time, however, capital flow has been multi-phased, and after the third peak in profit taking, the market has entered a consolidation/correction stage.
On the off chain side, a fragile balance had formed between long term holders’ selling and institutional demand through ETFs. However, as LTH distribution intensified (reaching around 122,000 BTC per month), net ETF inflows, which had averaged 2,600 BTC per day, nearly dropped to zero.
The result was fragile flows: a surge in spot volume during the sell off, sharp deleveraging in futures (with open interest falling from $44.8 billion to $42.7 billion), and in options, a spike in skew toward puts and a gamma overhang factors that tilt short term volatility in favor of downside moves.
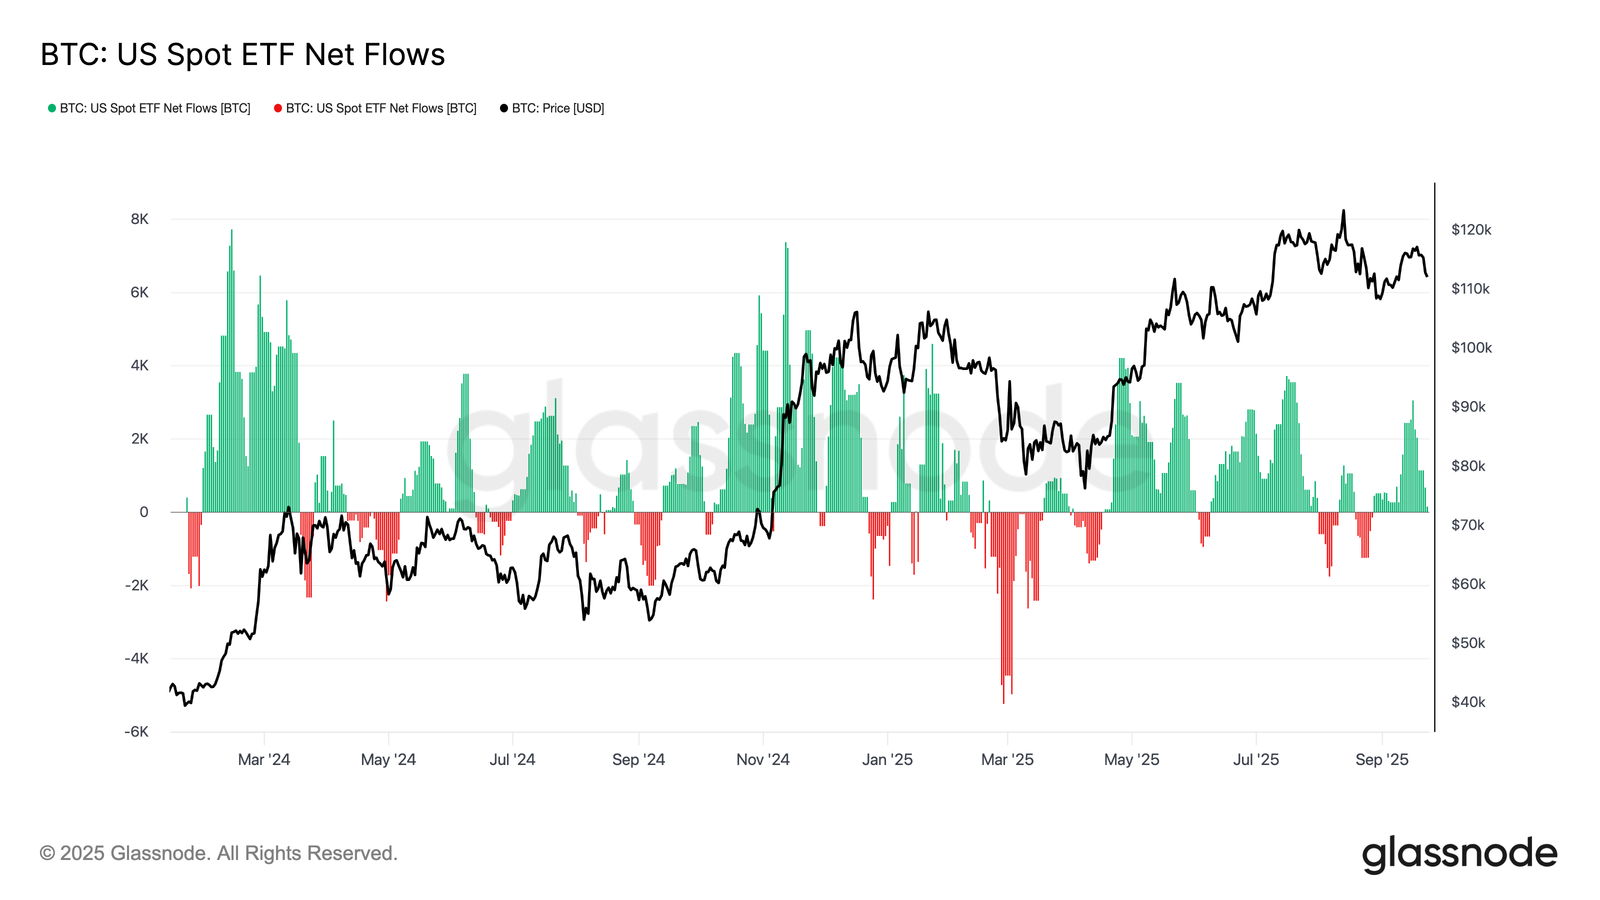
The broader picture shows weakening momentum and the dominance of liquidity driven volatility. As long as institutional demand (ETFs) does not realign with holder behavior and the $111K-$112K level is not maintained, the risk of a deeper correction remains high. However, the magnitude of the current correction is still mild compared to historical cycles, and each deleveraging reset can lay the foundation for a renewed balance provided demand strengthens again.
Oil and Major Position Shifts
WTI crude ended the week near$64.775, after climbing as high as$66.20on Friday morning before giving back part of its gains. The week began around$62.40, dipping even to$61.60, but from Tuesday onward, momentum turned bullish after reclaiming the $62.00 level: a sustained break above $63.00, a peak of $64.92 on Wednesday, and prolonged consolidation around $65.15 on Thursday. CFD prices may vary slightly among brokers due to forward contracts, but the overall direction across platforms remained bullish.
Narratives and Doubts:
Friday’s brief move above $66.00 was followed by a quick pullback, reinforcing the sense of market “nervousness.” Two main narratives were cited: reports of Russian air incursions into NATO airspace in Europe and stronger than expected US GDP data. However, the rally had already begun on Tuesday before the GDP release suggesting that a significant part of the move could simply be speculative buying and large players riding the momentum. For some traders, levels above $66.00 were seen as overbought, triggering late Friday selling.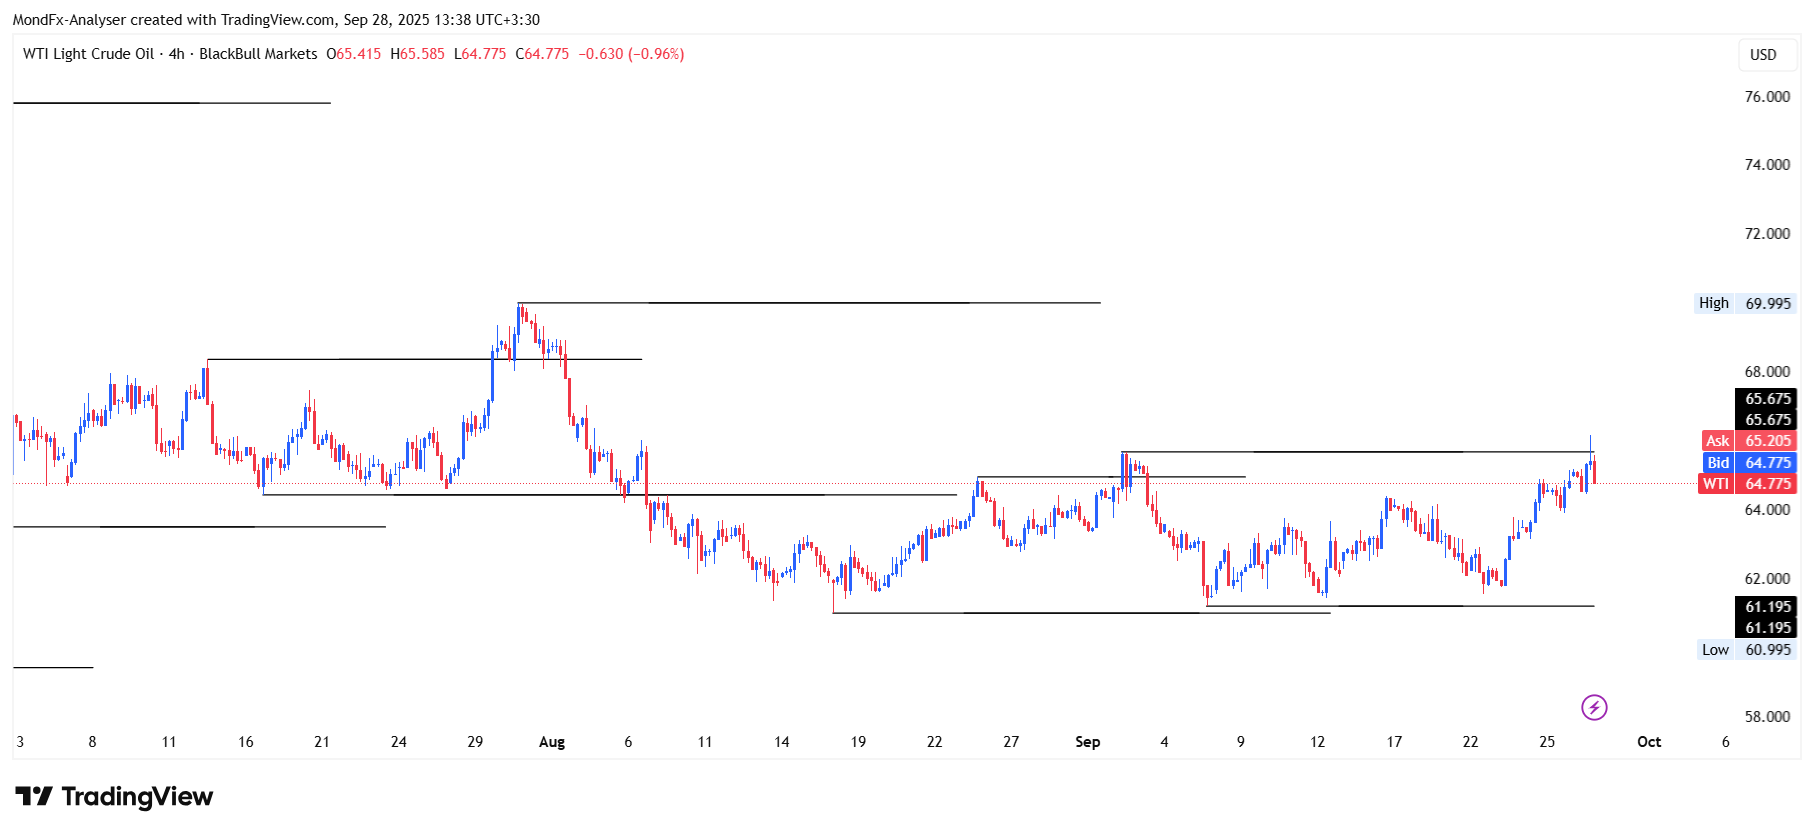
Technical Position and Historical Context
On the weekly and monthly timeframes, WTI has moved into higher ranges, although on the quarterly chart, prices still appear “mid range.” A one year view shows that trading above $66.00 for most of the year (up to August) has been a “legitimate playing field,” meaning that the recent breakout is not necessarily an excessive red flag for major players. The key question is: are we witnessing a “reset” into higher familiar ranges, or will the price return to medium term supports? In the background, supply is still described as abundant.
This Week’s Outlook
The speculative/estimated range for WTI is projected at$63.40 to $66.50. A closing price below $65.00 is still considered “average” from a historical perspective. Sustained supportive narratives (macro/geopolitical) could provide additional fuel for testing $66.50; conversely, a break below $63.40 raises the risk of a return to medium term supports. This week, the market will primarily test “participants’ interpretation of narratives.”
Conclusion
The weekly roadmap is as follows: as long as the dollar remains stable above reclaimed levels, pressure on risk assets will continue, and bullish breakouts in the DXY could rewrite the path for other markets. Gold, by holding mid range zones and short term resistances (3750 / 3791 / 3812), still holds the upper hand, and if a sustained breakout occurs, higher targets (4000 and even 5000) become more realistic. In crypto, the credibility of the short term bullish scenario hinges on defending the 111K-112K zone and reestablishing alignment between ETF demand and holder behavior; otherwise, the risk of a deeper correction persists. WTI crude, meanwhile, is testing narratives between63.40 and 66.50; breaking these ranges will determine the short term direction.
Overall, the coming week is both data driven and narrative driven: employment data, PMI releases, Fed officials’ comments, and any fresh geopolitical tensions could shift the balance. The recommended approach is scenario based and flexible, with a strong focus on risk management: until data and charts converge, keep position sizes optimized and tie decisions to valid breakouts or confirmed consolidations.
Comments
Solid roundup as always, keep them coming.
Useful summary. I'd just caution readers that consensus forecasts are already priced in — the trade is in the deviation, not the number itself.
Skipped reading the outlook one week and walked straight into a central bank surprise. Haven't missed one since.
Could you add expected volatility ranges for the major pairs each week? Would make position sizing much easier.
As someone new to fundamentals, these weekly outlooks help me connect the calendar events to actual price moves. Appreciate the plain language.