





The Best Oscillators for Volatility Trading
The Best Oscillators for Swing Trading include five main tools used in technical analysis to identify overbought and oversold conditions. RSI with 30-70 levels for detecting reversal points, MACD for identifying trend changes and divergences, Stochastic for short-term fluctuations with 20-80 levels, CCI for analyzing medium-term oscillations with ±100 lines, and Williams %R for rapid swing trading are the most suitable options. These oscillators help traders identify when the market is moving toward saturation, enabling them to determine the appropriate timing for market entry and exit. For optimal results, the combined use of multiple oscillators in short time frames along with risk management and attention to divergences is recommended.
What is an Oscillator and How Does it Function in Technical Analysis?
Oscillators are tools in technical analysis that help traders identify market fluctuations and make more precise trading decisions. These tools are typically displayed graphically and are positioned in specific areas of the chart. The main purpose of oscillators is to provide traders with signals for entering or exiting the market, especially when prices are in overbought or oversold conditions.
Oscillators are mostly used for analyzing markets with fluctuating trends. When the market is in a stable trend, these tools work well and can identify reversal points. The basis of these tools is usually comparing prices over a specific time period and analyzing their maximum and minimum points. Thus, oscillators can provide accurate information about the current market condition and the probability of changes in price direction.
One of the important features of oscillators is that they usually operate within a limited range of values. This feature helps traders identify points where the market is moving towards overbought or oversold conditions. This information is particularly important for swing trading, as traders can use these points as potential opportunities for buying or selling.
Application of Oscillators in Technical Analysis: Identifying Overbought and Oversold Points
One of the main applications of oscillators in technical analysis is identifying overbought and oversold points. In financial markets, when the price of an asset rises abnormally high (overbought) or falls abnormally low (oversold), this indicates that the current trend may soon change. Oscillators use price data and fluctuations to identify these points and alert traders that changes in price trends may occur.
In fact, when an oscillator enters overbought or oversold territories, it indicates that the market may reverse from that point. For example, in overbought conditions, there is a possibility that the price will decrease in the future, as there will no longer be new buyers to continue the upward trend. Conversely, in oversold conditions, there is a possibility of price reversal upward, as the market has reached a point where sellers no longer have a tendency to sell.
Traders can use oscillators to identify these reversal points and enter the market at the appropriate time. Typically, oscillators such as RSI and Stochastic are most commonly used to identify these points. These tools perform precisely in identifying overbought and oversold conditions and help traders make better decisions for swing trading.
The Best Oscillators for Swing Trading
In this section, we will introduce and examine some of the best oscillators for swing trading in financial markets. Each oscillator has its own characteristics and advantages, and for optimal use, traders need to become familiar with how each one works.
RSI (Relative Strength Index)
The Relative Strength Index (RSI) is one of the most widely used oscillators in technical analysis for identifying overbought and oversold conditions and market trend strength. This oscillator was introduced by J. Welles Wilder in 1978 and has since been recognized as one of the main tools of technical analysts. RSI ranges from 0 to 100 and is typically used to identify reversal points.
How to work with RSI: • Overbought and oversold: When RSI reaches above 70, this indicates an overbought condition, and the market will likely move downward. Conversely, when RSI falls below 30, this means oversold conditions, and an upward trend may begin. • Divergence: Divergence between RSI and price can provide signals for trend reversal. For example, if the price of an asset reaches its highest level but RSI reaches its lowest level, this is a bearish divergence that may indicate a trend change.
Application in swing trading: In swing trading, traders use RSI to identify market conditions where price reversal is likely. This oscillator helps traders use overbought and oversold points for timely market entry and exit.
MACD (Moving Average Convergence-Divergence)
MACD is one of the most advanced and popular oscillators in technical analysis that uses a combination of two moving averages (MA) to identify trends, trend strength, and divergences. This oscillator is actually created from the difference between the 12-day exponential moving average (EMA 12) and the 26-day exponential moving average (EMA 26). Additionally, a signal line is calculated as a 9-day moving average of the MACD.
How to work with MACD: • MACD line crossover with signal line: One of the most important signals in MACD is when the MACD line crosses the signal line from below, which is a buy signal. Conversely, when the MACD line crosses the signal line from above, it is considered a sell signal. • Divergence: Divergence between MACD and price can indicate a trend change. For example, if the price records its highest level but MACD is unable to record a similar highest level, this is a bearish divergence and may lead to a trend reversal.
Application in swing trading: Traders use MACD to identify trend changes and buy and sell signals. Also, due to the power of this tool in identifying divergences, MACD can be used as a powerful tool in detecting fluctuations and price changes in short time frames.
Stochastic Oscillator
The Stochastic Oscillator is a powerful tool for identifying overbought and oversold conditions that has many applications in technical analysis. This oscillator was developed by George Lane in the 1950s and is commonly used to identify reversal conditions in the market. The Stochastic Oscillator consists of two lines: the %K line (which is typically used to display the current price) and the %D line (the median or 3-day moving average of %K).
How to work with the Stochastic Oscillator: • Overbought and oversold: Like RSI, the Stochastic Oscillator also uses levels from 0 to 100. When the %K line rises above 80, the market is in an overbought condition, and a price decline will likely occur. Conversely, when the %K line falls below 20, the market has reached an oversold condition, and an upward trend may begin. • Crossover of %K and %D lines: Another important signal in Stochastic is when the %K line crosses the %D line from below, which means a buy signal, and conversely, when the %K line crosses the %D line from above, it creates a sell signal.
Application in swing trading: In swing trading, Stochastic is particularly useful in high-volatility markets. Traders use this oscillator to identify short-term reversal points. When Stochastic reaches overbought or oversold levels, there is a possibility of trend change and price reversal, which can create excellent swing trading opportunities.
CCI (Commodity Channel Index)
The Commodity Channel Index (CCI) is one of the important oscillators in technical analysis used for identifying trend changes and recognizing overbought and oversold conditions in financial markets. This oscillator was introduced by Donald Lambert in 1980 and is particularly useful for trend analysis in markets such as commodities, stocks, and forex. CCI compares the current price of an asset with the average price over a specific time period and then places the results within a limited range.
How to work with CCI: • Overbought and oversold: CCI typically fluctuates between +100 and -100. When the CCI index is above 100, it means an overbought condition and indicates that prices have reached their highest levels. In contrast, when CCI is below -100, this means an oversold condition, and an upward trend may begin. • Zero line crossover: Another important signal in CCI is when this oscillator crosses the zero line. When CCI crosses the zero line from below, it is considered a buy signal, and conversely, when CCI crosses the zero line from above, it creates a sell signal.
Application in swing trading: In swing trading, CCI helps traders identify market reversal points. When CCI reaches levels above +100 or below -100, traders can expect prices to change direction soon. This information can be very useful for identifying swing trading opportunities.
Williams %R
The Williams %R index, briefly referred to as %R, is one of the widely used oscillators in technical analysis for identifying overbought and oversold conditions. This oscillator was developed by Larry Williams in 1973 and is mainly used for identifying price reversal points in financial markets. Williams %R is very similar to the Stochastic Oscillator but with the difference that its scale is from zero to negative 100.
How to work with Williams %R: • Overbought and oversold: When Williams %R is above -20, it indicates an overbought condition, and the market will likely move downward. In contrast, when %R falls below -80, this means an oversold condition, and an upward trend may begin. • -50 line crossover: Another important signal in Williams %R is when this oscillator crosses the -50 line. When the index crosses the -50 line from below, this is considered a buy signal, and conversely, when it crosses the -50 line from above, it creates a sell signal.
Application in swing trading: In swing trading, Williams %R is very useful for identifying reversal points and predicting short-term price changes. This oscillator helps traders take advantage of overbought and oversold points and enter the market at appropriate times.
Comparison of the Best Oscillators for Swing Trading
In financial markets, each oscillator has its own unique characteristics that can help traders identify entry and exit points to the market. Depending on the different needs of traders, choosing the most appropriate oscillator depends on market conditions, trading style, and selected strategy. In this section, we compare five important oscillators and analyze the application of each in swing trading.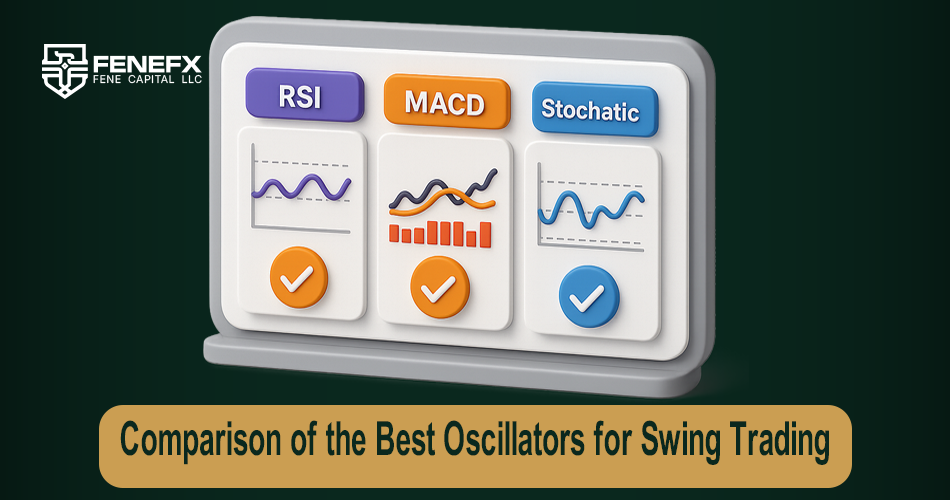
RSI or Relative Strength Index is one of the most basic and widely used tools for identifying overbought and oversold points. This oscillator can easily show traders whether an asset has reached an overbought level and will likely decrease, or has reached an oversold level and the price will likely go up. While MACD is mainly used for identifying trend changes and divergences, most traders use it to identify long-term changes and confirm buy and sell signals.
On the other hand, the Stochastic Oscillator, due to its greater sensitivity to short-term price changes, is often used for swing trading in markets where rapid price changes exist. This oscillator helps traders identify quick reversal points and overbought and oversold conditions. Similarly, CCI or Commodity Channel Index can be used to identify reversal points in the market, but this tool is more applicable for markets with large and medium-term fluctuations.
Finally, Williams %R, due to its simplicity in use and proper performance in short-term fluctuations, is another oscillator that helps traders take advantage of rapid market fluctuations. This oscillator is particularly suitable for those looking for quick price reversals.
Oscillator | Advantages | Disadvantages | Main Application |
| RSI | Clear signals, ease of use | May give false signals in strong trends | Identifying overbought and oversold conditions |
| MACD | Identifying divergences, trend analysis | Delay in signals in oscillating markets | Identifying trend changes and divergences |
| Stochastic | Accuracy in overbought and oversold conditions, sensitive to fluctuations | Gives false signals in strong trends | Identifying price reversals in fluctuations |
| CCI | Accurate identification of reversal points | High sensitivity to short-term fluctuations | Analysis of fluctuations and reversals |
| Williams %R | Simple and fast, good in short-term fluctuations | False signals in non-fluctuating markets | Identifying reversal points in fluctuations |
Practical Tips for Effective Use of Oscillators in Swing Trading
Using oscillators in swing trading can help traders identify the best trading opportunities in short time frames. For effective use of these tools, following several key points is essential.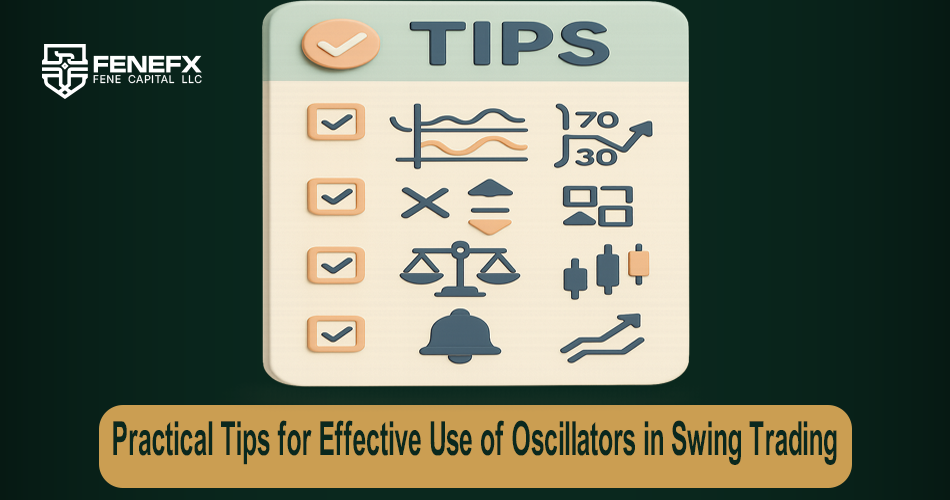
Combined Use of Oscillators
To increase the accuracy of signals, it is recommended to use a combination of several oscillators together. For example, you can use RSI to identify overbought and oversold conditions and MACD to identify trend changes. This combination can help you receive more accurate signals and make better decisions during times of severe market fluctuations.
Attention to Timing
Swing trading is mostly done in markets with short-term and rapid fluctuations. Therefore, choosing a short time frame such as 5 minutes or 15 minutes can help you quickly identify price changes and use them for timely market entry and exit. Also, using oscillators in these time frames can provide better signals for swing trading.
Combination with Other Analyses
To increase the probability of success in swing trading, it is recommended to combine oscillators with other technical analysis tools such as support and resistance lines, moving averages, and price patterns. This method can produce stronger signals and help you take advantage of more precise entry and exit points.
Precise Settings of Oscillators
The default settings of oscillators are usually suitable for general market conditions, but depending on the specific characteristics of the market or your trading strategy, you may need more precise adjustment. For example, in markets with low fluctuations, you may need to increase the sensitivity of the oscillator to better identify small price changes.
Risk Management
You should always pay attention to risk management, especially when using oscillators for swing trading. Oscillator signals may sometimes be delayed or give incorrect signals, so you should properly use Stop Loss and Take Profit orders to prevent large losses.
Reviewing Divergences
Divergences are one of the most important tools in oscillator analysis that can indicate a trend change. In particular, negative and positive divergences in oscillators can be signals for short-term trend reversal. Therefore, pay close attention to divergences.Conclusion
Oscillators play a crucial role in technical analysis for swing and short-term trading. Tools such as RSI, MACD, Stochastic, CCI, and Williams %R help traders identify overbought and oversold zones, trend reversals, and momentum shifts. Each oscillator has unique strengths, making them suitable for different market conditions. Using a combination of oscillators, proper timing, risk management, and supporting tools such as support–resistance zones significantly increases accuracy. Ultimately, understanding how each oscillator works and applying it wisely is the key to successful volatility-based trading.
Frequently Asked Questions
1. What is the best oscillator for swing trading?There is no single “best” oscillator, but RSI, Stochastic, and MACD are among the most reliable. Using them together improves accuracy.2. Which time frame is ideal for short-term trading?Time frames such as1-minute, 5-minute, and 15-minutecharts are most commonly used for fast swing or scalping strategies.3. Is one oscillator enough for accurate signals?Usually no. It’s recommended to combinetwo or more oscillatorsto reduce false signals and confirm market conditions.4. Do oscillators work well in trending markets?Some oscillators (like RSI and Stochastic) can give false signals in strong trends. MACD tends to perform better in trending conditions.5. Are divergences helpful for swing trading?Yes, divergences are among the strongest indicators of trend reversals and are highly effective for volatility-based trading.
Comments
Thanks! I never understood what actually separates an oscillator from a regular indicator until now. The RSI vs stochastic comparison finally made it click.
I spent a year jumping between RSI, CCI and stochastic looking for the 'best' one. Turned out my entries weren't the problem, my exits were. Still, wish I'd read this back then.
Clear and practical, the divergence section was the highlight for me.
Decent list, but oscillators alone will chop you up in trending markets. I'd only take overbought/oversold signals when they line up with structure — divergence without context is a trap.
Do you have recommended settings for lower timeframes? Default stochastic on M5 feels way too noisy. A follow-up on oscillator settings per timeframe would be great.