




What Is a Candle Shadow?
In candlestick analysis, most of the attention is usually focused on the body of the candle, while the true secrets of the market may actually be hidden in the shadows of these candles. Shadows are thin lines that reveal the hidden footprints of buyers’ and sellers’ strength. In this article, we take a professional look at shadows: what they signify, how they are read, and how they can transform our trading perspective.
What Is a Shadow in a Candle? Exact and Technical Definition
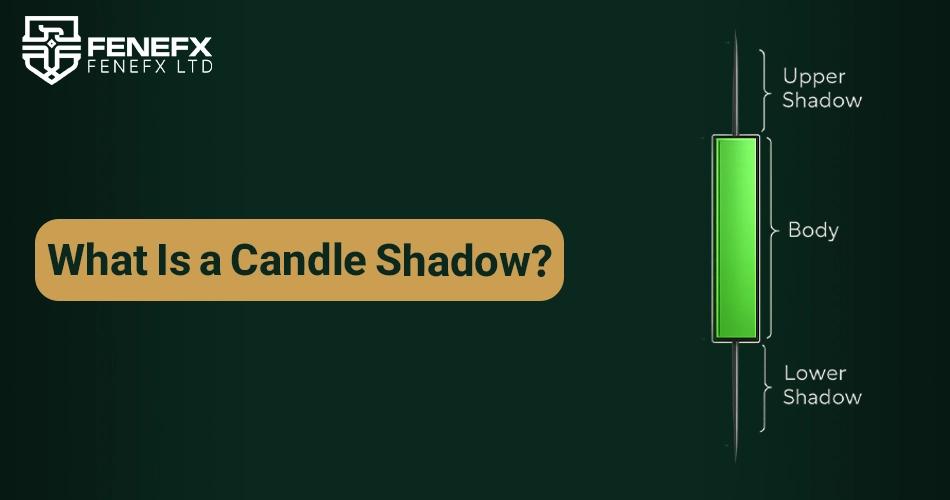
A shadow in a candlestick refers to the thin lines extending above or below the candle’s body. These shadows represent the highest and lowest prices recorded during the time frame of that candlestick’s formation. Unlike the candle body, which only shows the opening and closing price range, shadows capture the full spectrum of price fluctuations and provide a more realistic picture of market behavior.
What Is the Upper Shadow?
The upper shadow is the line that extends from the top of the candle’s body. This section reflects the highest price traded during that specific time period.
Simply put, if the price moved higher during the candle’s time frame but eventually closed below that peak, the upper shadow is formed. This indicates that buyers tried to push the price upward, but in the end, sellers managed to drive the market downward.
What Is the Lower Shadow?
The lower shadow is the line that extends from the bottom of the candlestick body. This shadow represents the lowest price reached during the specified time frame of the candlestick.
In other words, if the price dropped during that period but eventually closed higher than that level, the lower shadow is formed. This typically reflects the strength of buyers in pulling the price up from the market’s bottom.
The Role of Shadows in Technical Analysis
Shadows are among the essential tools in technical analysis, providing analysts with key insights into market psychology. These seemingly simple elements clearly reveal how much buying or selling pressure has existed during a given time frame and how the price has reacted to those pressures.
By examining the length and position of shadows on candlesticks, technical analysts can identify specific patterns and use them to forecast the potential direction of market movement. Generally, a long upper shadow indicates strong selling pressure and price rejection from a resistance area. In contrast, a long lower shadow signals strong buying pressure and price reversal from support levels.
Patterns such as the Hammer or Hanging Man are identified precisely based on the visual structure and the ratio of the shadow length to the candlestick body. These patterns help analysts better recognize potential reversal points or market trend changes.
The Ratio of Body to Shadow: Why Is It Important?
One of the key factors in candlestick analysis is the ratio between the length of the body and the shadows. This ratio helps us gain a clearer understanding of the battle between supply and demand during that specific time frame. Simply knowing whether a candlestick is bullish or bearish is not enough; we must also analyze how the price moved within that period and where it ultimately closed.
Long Shadow and Small Body: What Does It Indicate?
When we encounter a candlestick with a long shadow but a small body, it means that significant price fluctuations occurred during that time frame, but the closing price ended up not being far from the opening price. Such a situation indicates an intense struggle between buyers and sellers, with neither side able to gain full control over the market.
For Example:
Long Upper Shadow and Small Body
At first, buyers pushed the price higher, but sellers later applied strong pressure and dragged the price back down near the opening level. This can be a sign of buyer weakness or the presence of strong resistance in the market.
Long Lower Shadow and Small Body
At first, sellers pushed the price downward, but buyers managed to pull the market back up. This usually indicates the entry of demand and the presence of strong support.
Large Body and Short Shadow: Complete Dominance of One Side
When we see a candlestick with a large body and very short shadows or no shadows at all this indicates the absolute dominance of one side of the market (either buyers or sellers) during that time frame. In such a candlestick, the price has moved strongly in the same direction it opened, closing without much resistance or fluctuation.
Bullish Candlestick with a Large Body and No Shadow
The market was under the complete control of buyers, and the price rose steadily until the close without any pullback. This pattern is often observed in strong bullish trends.
Bearish Candlestick with a Large Body and No Shadow
Sellers had full control of the market, and the price closed strongly at its lowest point. This type of candlestick is typically seen in strong bearish trends and can sometimes signal buyer capitulation.
Long Shadows on Both Sides and Small Body: A Sign of Market Indecision
If a candlestick has long shadows on both sides and a small body, it usually indicates a state of confusion, hesitation, or indecision in the market. In such situations, both buyers and sellers have attempted to push the price in their desired direction, but ultimately neither succeeded, and the price closed near the opening level.
This scenario often signals the possibility of a trend reversal or the market entering a consolidation phase, a stage where traders are uncertain about the next direction.
Candlesticks of this type are commonly referred to as neutral candles or Doji with long shadows. Technical analysts interpret this formation as a warning of a potential pause in the previous trend or even a possible reversal, especially when it appears in key areas of the chart.
No Shadow: Absolute Certainty in Price Direction
Sometimes a candlestick may appear with no shadow at all, or only a very short shadow on one side. Such a candlestick indicates that the price moved in one clear direction from the opening to the closing without any reversal.
If the candlestick is bullish, it reflects the complete dominance of buyers; in other words, the market remained in an upward direction until the close without any correction or selling pressure. This type of candlestick is commonly known as a Bullish Marubozu.
On the other hand, if the candlestick is bearish and closes without a shadow, it signals the full strength of sellers and the weakness or capitulation of buyers. This candlestick is referred to as a Bearish Marubozu, and it is often observed when the market is experiencing a strong downtrend.
Long Lower Shadow and No Upper Shadow: Strong Rebound from Support
When we observe a candlestick with a long lower shadow and almost no upper shadow, it usually represents a positive reaction to a support level. This formation shows that the price initially moved downward under selling pressure but then rebounded as buyers entered and demand increased, eventually closing above its lowest point.
If such a candlestick appears at the end of a downtrend, it can signal the formation of a Hammer pattern, a bullish reversal signal widely recognized in technical analysis.
However, the reliability of this candlestick increases when it is confirmed by the following candle. In fact, analysts often consider this structure as an indication of the beginning of a potential market rebound, especially if it is accompanied by high volume or a strong support level.
Long Upper Shadow and No Lower Shadow: Reversal from Resistance
In contrast to the previous case, when a candlestick has a long upper shadow and no lower shadow, it usually indicates that the price has encountered resistance and the market has reacted negatively. In this situation, the price initially rose strongly but later declined as sellers entered, eventually closing near the opening level.
If this type of candlestick appears at the top of an uptrend, it may signal the formation of a Hanging Man or Shooting Star pattern. Both of these patterns, especially around resistance areas, are considered strong indications of a possible trend reversal and the beginning of a downward movement.
In summary, a long upper shadow under these conditions serves as a warning that the market is resisting further upward movement and may be on the verge of a reversal. Timely recognition of such candlesticks can provide an opportunity to exit buy positions or enter sell trades.
The Ratio of Shadow to Trading Volume
When price charts are analyzed alongside trading volume data, candlesticks and their shadows can be interpreted with greater depth. The length of shadows alone provides insights into market fluctuations and reactions, but when combined with volume, they create a clearer picture of the strength behind those movements.
For example, if a long shadow whether above or below the candlestick is accompanied by high trading volume, it usually indicates an intense battle between buyers and sellers, with many traders actively participating during that time frame. This often suggests that the market has reached a key support or resistance level and is attempting either to break through or to reverse from it. In such a case, high volume serves as confirmation of the validity of the long shadow and increases the likelihood of a powerful move unfolding in the subsequent price action.
On the other hand, if a long shadow is observed alongside low trading volume, it usually represents a temporary or emotional move without the support of major market participants. Such shadows often lack durability and tend to appear as short lived fluctuations in the market.
In this scenario, it can be said that an attempt was made to break a specific level, but it was not supported by strong traders or significant volume; therefore, the likelihood of a quick price reversal is high.
In general:
- Long shadow with high volume = a sign of strength and validity of the move.
- Long shadow with low volume = a sign of weakness and hesitation in continuing the move.
This analytical combination, especially near key technical levels such as supports, resistances, or supply and demand zones, can help traders make more accurate decisions.
The Importance of Shadows in Different Time Frames
Candlestick shadows in technical analysis do not always carry the same meaning, and their reliability strongly depends on the chart’s time frame. In fact, a shadow that appears on a 5 minute chart may have an entirely different implication when observed on a daily chart.
In lower time frames such as 1 minute, 5 minute, or even 15 minute charts, shadows are often influenced by rapid fluctuations, emotional trades, or the quick entry and exit of retail traders. As a result, many of these shadows are considered market noise and should not be relied upon as the sole basis for trading decisions. In these shorter time frames, a long shadow may simply be the result of a large order or a temporary reaction, rather than a true signal of trend reversal or a strong support/resistance level.
In contrast, in higher time frames such as 4 hour, daily, or weekly charts, shadows carry much greater significance. The formation of a long shadow in these intervals requires substantial price movement and extended market activity over a longer period. For this reason, such shadows usually reflect the market’s reaction to key levels, significant trading volume, or the entry of larger institutional investors.
In these conditions, analysts can use the length and direction of shadows to identify buying and selling pressure and even to forecast potential reversal points.
Therefore, when interpreting shadows, the time frame must always be taken into account. A shadow that looks concerning on a 5 minute chart may have no importance at all on the daily chart. Conversely, a shadow that appears on the weekly chart can serve as a crucial warning of structural changes in the overall market trend. This is where experience and a relative understanding of different time frames play a key role in technical analysis.
Frequently Asked Questions (FAQ)
What exactly is a candlestick shadow and what information does it provide?
A candlestick shadow is a thin line that appears above or below the body of the candle, representing the highest and lowest prices recorded during a specific time frame. These shadows provide a more realistic picture of market fluctuations and the struggle between buyers and sellers.
What is the difference between the upper shadow and the lower shadow?
The upper shadow reflects the highest price reached during the candlestick’s time frame and is often a sign of selling pressure or resistance against upward movement. In contrast, the lower shadow shows the lowest price during that period and usually indicates buying interest and market support.
What do candlesticks with long shadows and small bodies mean?
Such candlesticks represent a strong battle between buyers and sellers that ultimately ends without a decisive victory for either side. A long upper shadow typically signals buyer weakness, while a long lower shadow suggests strong buying pressure.
When can long shadows signal a trend reversal?
When an upper or lower shadow is unusually long and the candlestick appears near key levels such as support or resistance, there is a high probability of a trend reversal especially if the following candlestick confirms it (for example, through the formation of a Hammer or Hanging Man pattern).
What is the relationship between shadows and trading volume, and why does it matter?
If a long shadow is accompanied by high trading volume, it reflects a serious battle between buyers and sellers and often signals the possibility of a trend change. However, if volume is low, the shadow may simply be the result of temporary, insignificant market fluctuations.
Which patterns are identified based on shadows?
Patterns such as the Hammer, Hanging Man, and Shooting Star are identified through the ratio of shadow length to the candlestick body and are often highly significant at market reversal points.
Comments
Good primer, though I'd argue wick length only matters relative to recent candles. A 'long' shadow in a quiet session is just noise.
Do you weigh upper shadows differently on higher timeframes? A follow-up on wick analysis for daily vs 5min charts would be great.
Never understood why some candles have those long lines sticking out until now. The buyer/seller rejection explanation finally clicked for me, thanks.
Short and to the point, nicely done.
Long wicks at resistance have saved me more times than any indicator. Learned that the hard way after getting trapped in a breakout that was all shadow.