
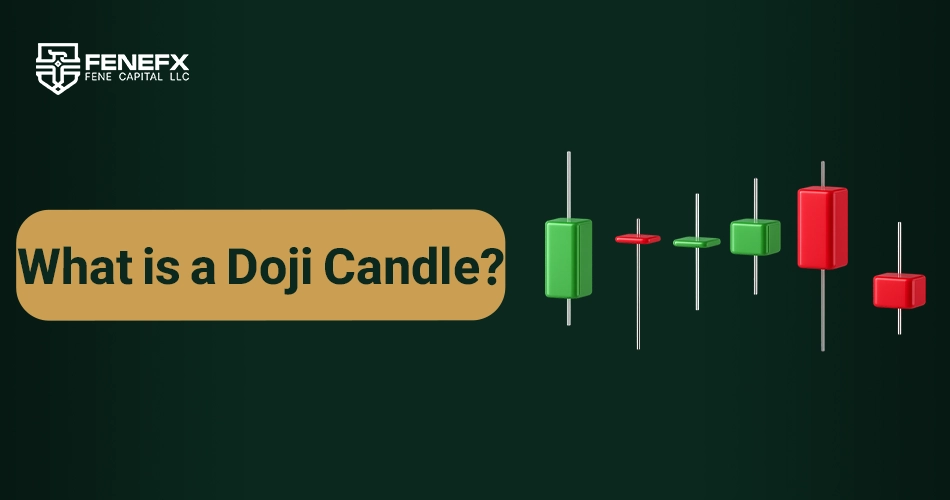
What is a Doji Candle and How to Identify It?
What is a Doji candle, and why do traders pay so much attention to it? If you’re even slightly familiar with technical analysis, you’ve probably heard of the Doji candle as one of the key patterns on price charts. This unique candle often appears at critical points in the market and can signal hesitation, pause, or even a potential trend reversal. But does every Doji candle necessarily mean the market is about to reverse? To find the complete answer and understand how different types of Doji candles can provide valuable clues about market behavior, continue reading to explore the full meaning, variations, and practical uses of this powerful pattern.
Different Types of Doji Candles and Their Differences
Doji candles have various types, each with its own characteristics that can provide different signals to traders in various market conditions. In this section, we will examine the different types of Doji candles and their differences.
1. Gravestone Doji
The Gravestone Doji is one of the important types of Doji candles that typically appears at the end of an uptrend. This candle has a very short body at the bottom and a long shadow in the upper part. The appearance of this candle indicates that the price has temporarily risen, but ultimately strong selling pressure has caused the price to decline and close near the opening price. The Gravestone Doji is typically a bearish signal that can indicate a trend change from bullish to bearish.
2. Dragonfly Doji
The Dragonfly Doji typically appears at the end of a downtrend and at support levels. This candle has a short body at the top of the candle and a long shadow in the lower part. The small body indicates uncertainty in the market, while the long shadow shows buying pressure. The Dragonfly Doji is usually a bullish signal and can indicate a reversal from a downtrend to an uptrend.
3. Long legged Doji (Christmas Tree Doji)
This type of Doji candle has long shadows on both sides, indicating extensive fluctuations during the candle's time period. This candle typically appears in conditions where the market is fluctuating between two support and resistance levels, and neither buyers nor sellers can dominate the other. The Long legged Doji is usually not considered a signal for a change in market movement, but it can indicate a temporary stopping point and uncertainty in the market.
4. Standard Doji
The Standard Doji is the simplest type of this pattern, where the opening and closing prices are very close to each other, and the upper and lower shadows are approximately equal. This candle usually indicates uncertainty in the market and can be a signal for a trend change or continuation of the current trend. The Standard Doji appears more in conditions where neither side of the market (buyers and sellers) has absolute power.
Why is the Doji Candle Important in Technical Analysis?
The Doji candle is one of the most important tools in technical analysis because it indicates specific market conditions that can help traders make better decisions. In this section, we examine the reasons for the importance of Doji candles in technical analysis.
1. Indicator of Uncertainty and Potential Trend Change
The Doji candle generally indicates a lack of clear decision making in the market. This candle occurs when buyers and sellers have reached a balance, and neither can dominate the other. This situation usually occurs at the end of a long trend or near support and resistance levels and can be a signal for a market trend change.
If a Doji candle forms at the end of an uptrend or downtrend, it may indicate that the current trend has ended and a new trend is beginning. Therefore, the Doji candle is recognized as an important indicator in identifying market reversal points.
2. Identifying Price Reversal Points and Support and Resistance Levels
One of the key features of a Doji candle is that it can appear near support and resistance levels. When a Doji candle is created near a resistance or support level, the likelihood of a market trend change is high. Specifically, when a Doji candle appears near a resistance level, it can act as a signal for reversing an uptrend and starting a downtrend. Conversely, when a Doji candle appears near a support level, it may be a signal for a market reversal and the beginning of an uptrend.
3. Trusting Doji Candles in Combination with Other Technical Tools
A Doji candle alone cannot be a strong signal, but when combined with other technical tools such as RSI indicators or moving averages, it can significantly increase the power of analysis. For example, if a Doji candle appears near a resistance level and simultaneously the RSI indicator shows overbought conditions, this combination can be a strong signal to enter a sell trade.
4. More Precise Determination of Entry and Exit Points
Doji candles help traders identify more precise entry and exit points. If a Doji candle appears in an uptrend, it may be considered a signal to exit the market and secure profits. Also, in downtrends, a Doji candle can act as a signal to enter the market in the reverse direction.
Identifying Different Types of Doji Candles on Charts
To identify Doji candles on price charts, you should pay attention to their structural characteristics. As mentioned earlier, Doji candles have different types that may appear in different market situations. In this section, we discuss how to identify different types of Doji candles.
Gravestone Doji
This candle typically appears at the end of an uptrend and indicates a potential trend change towards a decline. The characteristics of this candle include:
• Short body or nobody at the bottom of the candle
• Long shadow in the upper part
• Appearing near a resistance level
In identifying this type of candle, you should pay attention to how the price changes in the price bar. When the price reaches its highest level and then returns downward, a Gravestone Doji forms.
Dragonfly Doji
The Dragonfly Doji typically appears at the end of a downtrend and indicates a price reversal upward. The characteristics of this candle include:
• Small body at the top of the candle
• Long shadow in the lower part of the candle
• Appearing near a support level
In identifying a Dragonfly Doji, you should note that the price has experienced its lowest level during the candle period, but ultimately, buying pressure has led to the price returning to a higher level.
Long legged Doji (Christmas Tree Doji)
The Long legged Doji typically appears in conditions where the market is in doubt and experiencing extensive fluctuations. The characteristics of this candle are:
• Small body in the middle of the candle
• Long shadows on both sides
• No clear direction in price trends
Identifying this candle is particularly important as it can act as a warning signal for market changes. This candle usually appears near support and resistance levels.
Standard Doji
The Standard Doji is the simplest type of this candle. Its characteristics are:
• Very short body or nobody
• Balanced shadows at the top and bottom
• Equal opening and closing prices
This type of candle usually appears in conditions where neither buyers nor sellers control the market, and the market is currently in a state of doubt and waiting.
Examining Doji Candle Signals in Combination with Other Analysis Tools
In technical analysis , a Doji candle alone may not be a strong enough signal, and it is better to use it in combination with other analysis tools. Some of these tools include technical indicators, trend lines, and support and resistance levels.
For example, if a Doji candle appears near a resistance level and simultaneously the RSI indicator also indicates an overbought condition, this combination can be considered a strong signal for a trend change and entering a sell trade. Similarly, if a Doji candle is located near a support level and the MACD indicator gives a buy signal, this combination can be a signal for a trend reversal from bearish to bullish.
Application of Doji Candles in Trading Strategies
As one of the important candlestick patterns in technical analysis, the Doji candle has extensive applications in designing trading strategies. Traders use Doji candles to identify price reversal points, enter or exit the market, and confirm various trends. This candle is especially useful in identifying potential trend changes and can be used as an effective tool in trading strategies.
1. Reversal Strategy Using Doji Candles
One of the most common applications of Doji candles is in reversal strategies. When a Doji candle forms at the end of an uptrend or downtrend, it may be a sign of a trend change and its reversal. Typically, when a Doji candle appears near resistance levels in an uptrend or near support levels in a downtrend, the likelihood of a trend change is higher.
For example, when a Doji candle appears at the end of an uptrend and is followed by a large bearish candle, this combination can be considered a signal to enter a sell trade. Similarly, if a Doji candle appears near a support level in a downtrend and is followed by a bullish candle, there is a possibility of a bullish trend reversal.
2. Trend Confirmation Strategy Using Doji Candles
Doji candles can also be used to confirm an existing trend. In this case, the Doji candle acts as a signal of market uncertainty that can confirm the continuation of the trend. For example, if an uptrend is forming and after a Doji candle, another bullish candle appears, this can be a confirmation for the continuation of the uptrend. Similarly, in a downtrend, the appearance of a Doji candle followed by a strong bearish candle can act as confirmation of the continuation of the downtrend.
3. Entry and Exit Strategy with Doji Candles
Doji candles are used as a useful tool for identifying market entry and exit points in trading strategies. For example, if a Doji candle forms near a resistance level, it can be considered a signal to exit the market or enter a sell trade. Similarly, when a Doji candle is created near a support level, it can be a signal to enter a buy trade.
These strategies are particularly useful in shorter time frames such as 1 minute or 5 minutes, where rapid price changes are important.
Difference Between Doji Candles and Other Candlestick Patterns
The Doji candle is one of the most important candlestick patterns, but it differs from other candlestick patterns such as Marubozu, Engulfing, and Hammer candles, which can help traders in making trading decisions. In this section, we compare the Doji candle with some other famous candlestick patterns.
1. Doji Candle vs. Marubozu Candle
A Marubozu candle is a candle with a completely filled body that has no shadow or very small shadows. Unlike the Doji candle which has a short body, the Marubozu candle indicates the clear strength of one side of the market (buyers or sellers). For example, in a bullish Marubozu candle, the opening and closing prices of the candle are at a higher level than previous prices and indicate strong buying pressure. While the Doji candle indicates uncertainty and the market's inability to make decisions, the Marubozu candle is typically a strong signal for the continuation of the current trend.
Doji Candle vs. Engulfing Candle
The Engulfing candle is one of the famous candlestick patterns in which a large candle with a direction opposite to the previous trend "engulfs" or swallows its previous candle. This pattern is usually a sign of a trend change. Unlike the Doji candle which indicates doubt and uncertainty, the Engulfing candle is a strong signal for a trend change. If a Doji candle appears in an uptrend or downtrend and is followed by an Engulfing candle, this combination can be a signal for a trend change.
Doji Candle vs. Hammer Candle
The Hammer candle is a special candle that has a long lower shadow and a small body at the top of the candle. The Hammer candle typically appears at the end of a downtrend and indicates a potential reversal of the trend towards an uptrend. Unlike the Doji candle which indicates doubt, the Hammer candle is usually a strong bullish signal indicating the beginning of an uptrend. However, if a Doji candle appears at the end of a downtrend and then a Hammer candle forms, this can be a strong signal for a trend reversal.
If you want to put your technical analysis skills including reading Doji candles, into real trading practice, getting a prop account can be the perfect place to start. Buying prop from FeneFx allows you to trade with virtual capital under real market conditions, test your strategies, and potentially attract real investors if you succeed. It’s one of the safest and most professional ways to enter the world of serious trading.
Examining the Accuracy and Reliability of Doji Candle Signals
The Doji candle as a technical analysis signal can be accurate and reliable in some cases, but it should be noted that it cannot be relied upon alone. In this section, the accuracy and reliability of Doji candle signals are examined, and it is explained how these signals can be used effectively.
1. Reliability of Doji Candle Signals in Shorter Time Frames
In shorter time frames, a Doji candle can provide a quick and immediate signal of price changes. However, in larger time frames, a Doji candle may not indicate a significant change in trend and is better combined with other technical tools.
2. Using Doji Candles in Combination with Other Indicators
The best way to increase the accuracy of Doji candle signals is to use them in combination with other indicators and tools. For example, using the RSI indicator to identify overbought and oversold points can increase the accuracy of Doji candle signals. If a Doji candle forms when the RSI is in an overbought or oversold condition, this can be a powerful signal for a trend change.
3. Accuracy of Doji Candle Signals Near Support and Resistance Levels
A Doji candle will be a stronger signal when it appears near support or resistance levels. In these conditions, the likelihood of a trend change is higher, as the Doji candle can indicate doubt and a change in market direction. Therefore, identifying Doji candles in such positions can help traders make better decisions.
Additional Tips for Effective Use of Doji Candles in Market Analysis
For effective use of Doji candles in analyzing financial markets, traders should consider a few additional points. These points will help you utilize this candlestick pattern more accurately.
1. Using Doji Candles in Combination with Other Candlestick Patterns
Doji candles can provide stronger signals when combined with other candlestick patterns. For example, if a Doji candle appears alongside an Engulfing candle, this combination can be a signal for a trend change. Also, alongside Marubozu candles, a Doji candle can indicate doubt in the continuation of the trend.
2. Attention to Trading Volume
Trading volume is one of the important factors in confirming Doji candle signals. If a Doji candle forms with high volume, this indicates that the market is experiencing a major change. If a Doji candle forms with low volume, the credibility of its signal decreases, and it should be approached with more caution.
3. Testing Strategies in a Demo Account
Before using Doji candle signals in real trades, it is recommended to first test these strategies in a demo account. This helps you examine different methods of using Doji candles without financial risk and find the best strategy.
Conclusion
The Doji candle is one of the most important patterns in technical analysis, representing market indecision between buyers and sellers and potentially signaling a trend reversal or temporary pause in price movement. Understanding the different types of Doji candles, helps traders identify critical market points more accurately. However, relying solely on the Doji pattern without considering other analytical tools like RSI, MACD, and support or resistance levels can lead to false signals. Therefore, combining the Doji candle with other technical indicators, applying proper risk management, and paying attention to trading volume are the best ways to use this essential pattern effectively in trading decisions.
Frequently Asked Questions
1. Does a Doji candle always indicate a trend reversal?
No, a Doji candle doesn’t always signify a trend reversal, in many cases, it simply shows market hesitation or a temporary pause and should be confirmed with other tools.
2. Which type of Doji candle provides the strongest signal?
The Gravestone Doji and Dragonfly Doji generally offer stronger signals, especially when they form near key support or resistance levels.
3. How can a trader use the Doji candle to enter a trade?
If a Doji candle appears alongside other indicators, such as RSI divergence or a trendline breakout it can serve as a reliable signal for entering or exiting a trade.
Comments
The candlestick series on this blog keeps getting better.
How do you tell a dragonfly doji from a hammer in practice? They look almost identical to me. A side-by-side comparison post would be great.
I used to think a doji automatically meant reversal and kept jumping in early. The bit about waiting for confirmation finally explained my losses. Thanks!
Context is everything with dojis. One at a major resistance after an extended trend means a lot; one in the middle of a range means nothing. Location over pattern, always.
Caught a dragonfly doji at support on gold last week, waited for the confirmation candle like you suggest, and it turned into my best trade of the month.