




What is a Trigger Line? Understanding the Core Concept
A trigger line is essentially an auxiliary line that is typically used in specific price patterns such as channels, Andrews' pitchfork, or even simple trends. This line usually acts as a warning tool and shows traders that the price may be changing direction or approaching a sensitive point. For this reason, the trigger line serves as a predictive tool and allows traders to be prepared before major price movements occur.
Understanding the trigger line concept requires basic knowledge of trendlines and how price behaves in the market. Simply put, a trigger line is a hypothetical line drawn alongside the main trend lines or channel. This line typically serves as an indicator to confirm a breakout or continuation of a trend. While classic trend lines usually only show support and resistance points, the trigger line helps you identify potential price movements even before they reach these points.
How to Draw a Trigger Line? Step by Step Guide for Beginners
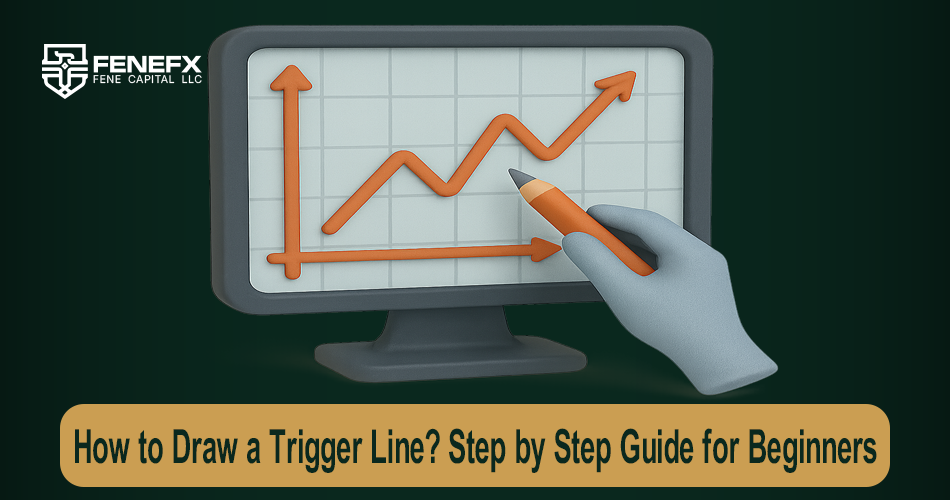
Drawing a trigger line may seem complicated at first, but you can easily implement this tool on your charts by following a few simple steps. The most important point in drawing a trigger line is knowing that this line should act as an auxiliary tool, not a fixed rule. Below are step by step instructions for drawing a trigger line:
Identify the Main Trend
First, you must determine what type of trend the market is in: bullish, bearish, or neutral. This step is very important because the trigger line is usually drawn in the direction of the main trend.
Draw the Main Trend Lines or Channel
At this stage, draw the main support and resistance lines. These lines typically help you define the price movement range. If you are using Andrews' pitchfork, the median and parallel lines of this tool themselves play the role of trendlines.
Draw the Trigger Line
To draw the trigger line, first find two key points on the chart. These points usually include a price bottom and top that play an important role in the current trend. Now draw a line from one of these points to another, so that the line aligns with the overall market trend. This line should be drawn in such a way that there is a possibility the price will meet it.
Examine the Trigger Line on the Chart
After drawing the trigger line, you should examine its performance on the chart. Does price react to this line? Can this line identify entry or exit points for you? If the answer is positive, your trigger line has been drawn correctly.
Important Note: For more accurate drawing of the trigger line, use technical analysis tools such as platforms like TradingView or MetaTrader. These tools allow you to draw lines on the chart with greater precision.
The Logic Behind the Trigger Line Strategy: Why is This Tool Effective in Financial Markets?
The trigger line strategy is not just a simple tool; behind it lies strong and scientific logic that has been formed based on market behavior and trader psychology. To better understand this logic, we should know that financial markets are constantly influenced by supply and demand forces. These forces drive price movements and ultimately form price patterns.
Identifying Sensitive Points in the Market
One of the most important reasons for the effectiveness of the trigger line is its ability to identify sensitive market points. These points are usually locations where trading volume significantly increases or major price changes occur. The trigger line helps traders predict these points.
Change in Supply and Demand Balance
The trigger line is usually drawn when the market is experiencing changes in the supply and demand balance. These changes cause the price to approach the trigger line and ultimately, upon meeting it, choose a new path. In fact, the trigger line helps you identify these changes before they occur.
Combining Technical Analysis and Market Psychology
One of the reasons for the popularity of the trigger line among traders is the combination of technical logic with market psychology. This line is not only a technical tool but also shows you how other traders view the market. In other words, the trigger line helps you understand the collective mindset of the market.
Predicting Price Movements
One of the prominent features of the trigger line is its ability to predict price movements. This tool helps you understand how the price might behave in the future. For example, if the price approaches the trigger line and then breaks it, a strong movement will likely occur in the direction of the breakout.
How to Find Precise Entry and Exit Points with the Trigger Line?
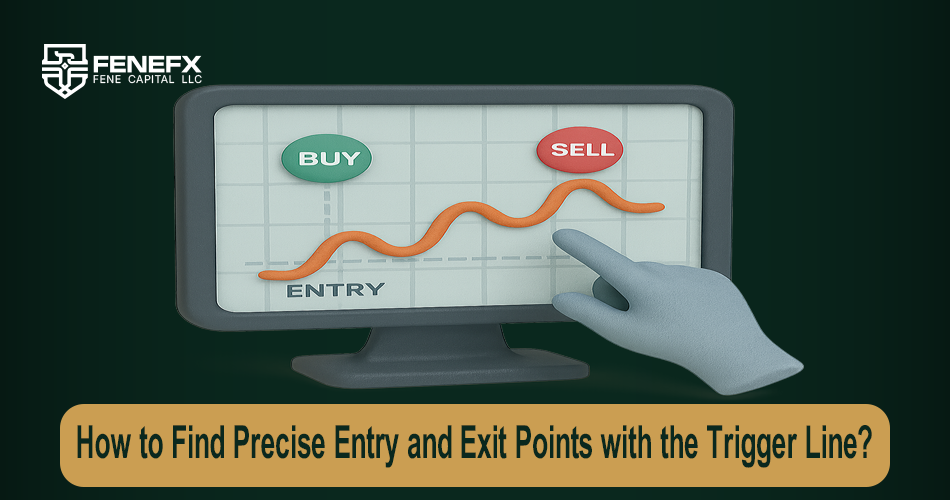
One of the most important applications of the trigger line is identifying entry and exit points in trades. This tool helps traders make lower risk trades and increase their chances of success by using information obtained from charts. In this section, we will explain in simple and practical language how you can determine your entry and exit points using the trigger line.
Analyzing Price Contact Points with the Trigger Line
Once you have drawn the trigger line, you should pay special attention to positions where the price makes contact with this line. These contact points usually indicate moments when the market is deciding whether to continue or change direction. If the price approaches the trigger line and then breaks it, it is usually a sign of a strong movement in the same direction as the breakout. In this case, you can use this breakout as an entry signal.
Using Additional Confirmations
The trigger line alone cannot definitively determine entry and exit points. To increase accuracy, it is recommended to use other tools such as RSI, MACD indicators, or trading volume. For example, if the price breaks the trigger line and simultaneously the RSI indicator shows entry into the overbought or oversold zone, the probability of your trade's success will be higher.
Setting Stop Loss and Take Profit
One of the most important points to observe in trades based on the trigger line is setting stop loss and take profit. You can set your stop loss slightly below the trigger line (in bullish breakouts) or slightly above it (in bearish breakouts). Take profit is usually determined based on other analyses or risk to reward ratio. For example, if the trigger line is near a strong resistance, you can set your take profit slightly below this resistance.
Combining the Trigger Line with Price Patterns
The trigger line can provide much stronger signals when combined with price patterns such as triangles, flags, or head and shoulders. For example, if the price is in a bearish triangle pattern and breaks the trigger line downward, you will likely see a strong bearish movement.
Advantages and Disadvantages of the Trigger Line Strategy: Is This Tool Right for You?
The trigger line, as one of the popular technical analysis tools, has its own specific advantages and limitations. This tool, with its simplicity in drawing and ability to be used in all financial markets, early prediction capability of price changes, and high compatibility with other indicators, is particularly attractive for beginner traders. However, on the other hand, dependency on confirming tools, sensitivity to drawing quality, and vulnerability to false fluctuations are among the points that must be considered. The choice of this strategy depends on each trader's trading style, level of experience, and personal preferences.
Advantages | Disadvantages |
| Simplicity in drawing and use even for beginners | Need for additional confirmations from other tools |
| Universal application in all financial markets | Possibility of error in case of incorrect drawing |
| Early prediction of potential price changes | High sensitivity to false and temporary fluctuations |
| High combinability with indicators and price patterns | Failure to provide definitive signals alone |
Most Common Mistakes in Using the Trigger Line and How to Prevent Them
Proper use of the trigger line can help with more accurate trades and better decision making, but like any other technical analysis tool, if not used correctly, it can lead to mistakes and losses. In this section, we examine the most common mistakes traders make when using the trigger line and provide solutions to prevent them.
1. Incorrect Drawing of the Trigger Line
One of the most common mistakes is incorrectly drawing the trigger line. Beginner traders may select incorrect points for drawing, such as using irrelevant price points or drawing a line that does not align with the overall market trend. This mistake can create incorrect signals and lead to wrong decisions.
Solution: To prevent this mistake, first make sure that the points you select for drawing the trigger line are key points on the chart. These points usually include important tops and bottoms in the current trend. Also, using reliable tools like TradingView or MetaTrader can help with greater accuracy.
2. Not Paying Attention to the Main Market Trend
Another common mistake is using the trigger line without considering the overall market trend. Traders sometimes draw the trigger line in the opposite direction of the trend or use it in neutral markets, which can lead to receiving incorrect signals.
Solution: Always identify the main market trend first. If the market is bullish, the trigger line should be drawn in the direction of supporting the bullish trend, and if the market is bearish, in the direction of resistance. In neutral markets, it's better to use other technical analysis tools and only use the trigger line when the market enters a specific trend.
3. Not Using Additional Confirmations
One of the biggest mistakes is completely relying on the trigger line as the only decision making tool. In some cases, the price may temporarily break the trigger line and then return to the main path. These false fluctuations can mislead traders.
Solution: Always use additional confirmation tools such as RSI, MACD indicators, moving averages, or trading volume. These tools can help you check and confirm trigger line signals.
4. Not Setting Stop Loss and Take Profit
Many traders, due to not setting stop loss and take profit levels, may incur significant losses in case of sudden market changes. The trigger line alone cannot tell you when to close a trade.
Solution: Place the stop loss slightly below the trigger line (in bullish breakouts) or above it (in bearish breakouts). Also, set your take profit based on important resistance or support levels.
5. Using the Trigger Line in All Market Conditions
The trigger line is not effective in all market conditions. For example, in markets with severe fluctuations or during important news releases, this tool may lose its effectiveness.
Solution: Before using the trigger line, analyze market conditions. During volatile times or economic news releases, it's better to use other tools or avoid trading.
How to Integrate the Trigger Line Strategy into Your Trading System?
Using the trigger line as part of a comprehensive trading system can help improve performance and reduce risk. But for effective integration of this tool, a structured approach and coordination with other trading tools and techniques is necessary. In this section, key steps for integrating the trigger line into your trading system are explained.
1. Determine the Role of the Trigger Line in Your Trading System
The first step for integrating the trigger line is determining its role in your trading system. Do you want to use the trigger line as a primary tool for identifying entry and exit points or as a confirmation tool alongside other strategies?
If you use the trigger line as the main tool, be sure to combine it with other tools such as trend indicators or price patterns to receive stronger signals.
2. Combine with Other Tools
Successful trading systems usually use a combination of several tools to confirm and strengthen signals. The trigger line can be combined with the following tools:
- Trend indicators (such as moving averages) to confirm market direction.
- Oscillator indicators (such as RSI or MACD) to identify overbought and oversold points.
- Trading volume to confirm trigger line breakouts.
Example: If the price breaks the trigger line and simultaneously the trading volume increases and the RSI indicator also shows entry into the overbought zone, the probability of the trade's success will be higher.
3. Risk and Capital Management
Integrating the trigger line into your trading system without proper risk management can be dangerous. Every trade you make based on the trigger line should be accompanied by a risk management plan.
Risk Management Tips:
- Risk a maximum of 1 to 2 percent of your capital for each trade.
- Always use stop loss and determine it based on the position of the trigger line.
- Consider a risk to reward ratio of at least 1:2.
4. Testing and Optimization
Before using the trigger line as part of your trading system in a real account, be sure to test this strategy in a demo account. Check how the trigger line performs in different market conditions and whether it is compatible with your trading style.
Solution: Use backtesting or forward testing in trading platforms to examine the performance of the trigger line in the past and future market. Also, you can optimize different parameters such as line drawing points or tool combinations.
5. Continuous System Updates
Financial markets are dynamic, and their behavior may change. Therefore, it is necessary to continuously review and update your trading system.
Evaluate the performance of the trigger line in your trading system periodically and, if necessary, change the parameters or combination of tools.
Comments
What settings do you recommend for the trigger line on a 4H chart? Also would love an article comparing it with a simple signal-line crossover.
Added a trigger line to my MACD setup last year and it honestly cut my false entries down a lot. Wish I'd read something like this earlier.
Decent intro, but worth saying the trigger line lags like any moving-average-based tool. I use it for confirmation only, never as the entry signal itself.
I kept seeing 'trigger line' in strategy videos and nodding along without a clue. Your step-by-step chart example made it click. Cheers!
Clean explanation, finally makes sense.