




What is the Relative Strength Index Indicator?
The Relative Strength Index or RSI is a technical analysis indicator used to measure the strength or weakness of price movements in a market. This indicator, introduced by John Welles Wilder in 1978, is specifically designed to identify potential trend reversal points. RSI has a scale of 0 to 100 that can show analysts when an asset is in overbought or oversold conditions. This index is particularly useful in markets with rapid and volatile price changes.
Purpose of Designing this Indicator
The main purpose of designing RSI is to measure price changes over a specific time period. This indicator helps analysts determine whether an asset has reached overbought or oversold levels and whether a trend reversal is likely. Since this indicator focuses more on price fluctuations in the short term, it is very useful for identifying trading opportunities in volatile markets.
RSI's Position in Technical Analysis
RSI is one of the most well-known and widely used technical analysis tools. This indicator is typically used alongside other technical analysis tools such as trend lines, support and resistance levels, and candlestick patterns. The most important feature of RSI is that it provides the strength and weakness of a trend to the trader in a simple and understandable way. It can also be used independently or in combination with other indicators to confirm buy or sell signals.
How the RSI Indicator Functions in Price Analysis
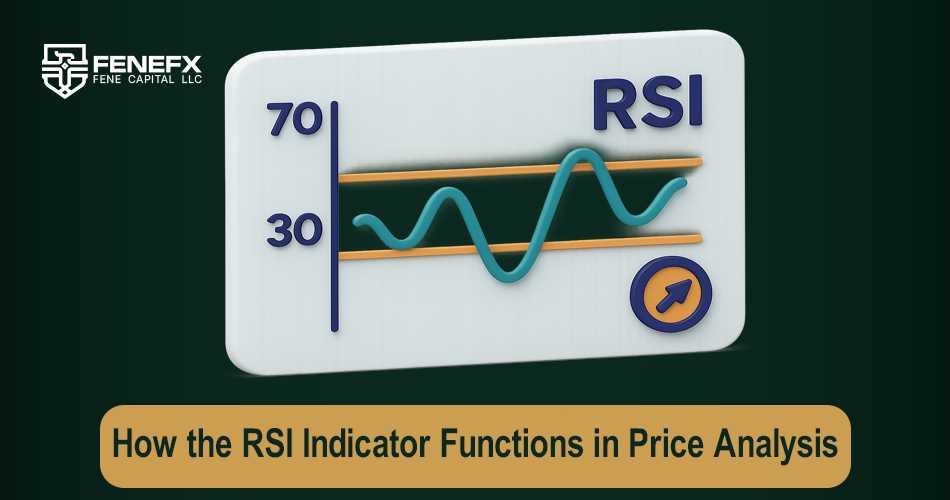
The RSI indicator is calculated using a simple mathematical formula. This formula briefly calculates the difference between the average of upward and downward price changes over a specific time period (usually 14 days). To perform these calculations, first, the price changes for each time period are calculated, then the average of positive and negative changes is obtained. Finally, RSI is derived by dividing the average positive changes by the sum of positive and negative averages. The final result is displayed as a percentage between 0 and 100 directly on the chart.
The Role of Time Period in Signal Accuracy
The default time period value for RSI is usually 14, but this value can be adjusted depending on the trading strategy. A shorter time period may cause premature signals and more fluctuations in the RSI chart, while a longer time period creates more accurate signals but may react later. Choosing an appropriate time period should be based on the type of trading strategy and the trader's risk tolerance.
RSI Reaction in Trending and Trendless Conditions
RSI reacts differently in various market conditions. In a trending market (bullish or bearish), RSI can remain in overbought or oversold areas for a long time without providing a signal for trend change. This is especially evident in markets with fast and strong price movements. In contrast, in trendless or neutral markets, RSI often fluctuates between 30 and 70, and trend reversal signals can be more accurate and reliable.
Interpreting Key Ranges in the Relative Strength Index
The 30 and 70 ranges on the RSI chart are of great importance and are usually considered reference points for identifying overbought and oversold conditions. When RSI reaches above 70, it usually indicates that the market is in an overbought condition, and there is a possibility of the trend reversing downward. On the other hand, when RSI falls below 30, it indicates an oversold condition, and the price may reverse upward. However, it should be noted that these levels are not definitive signs of trend reversal, and in continuous trending markets, RSI may remain in these areas for a long time.
Analysis of Overbought and Oversold Conditions
When RSI enters the overbought zone (above 70), it indicates that the price has risen rapidly and unnaturally. In this case, the price may correct downward. Conversely, when RSI falls below 30, this indicates oversold conditions and the likelihood of price reversal upward. These concepts essentially help analysts identify critical entry and exit points, although these analyses should always be aligned with other technical analysis tools.
Difference in RSI Signals in Trending and Neutral Markets
In trending markets, RSI can consistently remain in overbought or oversold areas without creating a real reverse signal. In such cases, the use of RSI signals should be done with caution because in strong trends, the price may remain in the saturation side without any major change. In neutral markets, RSI usually fluctuates between 30 and 70 and can provide more reliable reversal signals.
Signal Detection Using Internal RSI Structures
Identifying Divergences in RSI Chart
Divergences are one of the important signals in technical analysis that, combined with the RSI indicator, can effectively be used to identify trend changes. Divergence occurs when the price of an asset moves toward a new point, but the RSI index does not confirm this movement and behaves differently. In other words, in bullish divergences, the price is making a new lower bottom, but RSI forms a new bottom higher than the previous bottom, indicating weakness in the downtrend and possibly a reversal upward will occur. In bearish divergences, the price moves towards new highs, while RSI is unable to make a new high, and thus the uptrend may weaken and a reversal downward may begin.
Examining Reversal Signals of the Failure Swing Type
Another important RSI signal is the Failure Swing signal. A failure swing occurs when the price moves towards a new level, but RSI is unable to confirm this movement and sends a signal for trend reversal. This type of signal is usually created when the price is moving towards a new peak or bottom, but RSI does not completely follow this movement. This signal is usually more valid than a divergence signal because it is directly established from the market structure and price movement.
How to Detect Price Breakouts with RSI Confirmation
If a price breakout at a support or resistance level occurs suddenly, using RSI can be very useful to confirm the validity of this breakout. When the price crosses a specific support or resistance level, if RSI also confirms this movement and does not enter overbought or oversold areas, the price breakout will likely be valid. In such conditions, RSI acts as an auxiliary tool to confirm other signals. Additionally, if RSI moves quickly in the direction of the breakout, it can indicate the continuation of the new trend and the strength of the price movement.
Combining RSI Indicator with Other Analysis Tools
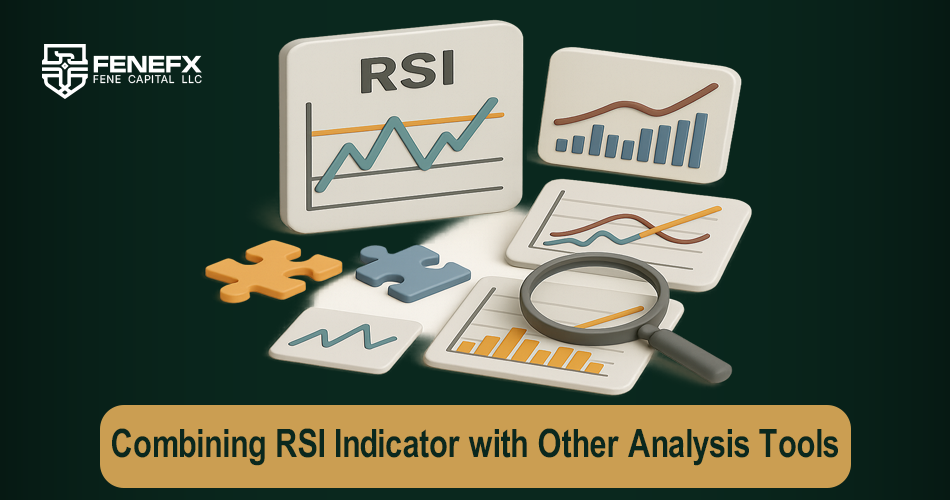
An effective method to confirm RSI signals is to combine it with candlestick patterns. Candlestick patterns such as reversal patterns (like hammer, shooting star, and inverted hammer) or continuation patterns (like triangle and flag patterns) can significantly increase the accuracy of RSI signals. For example, if RSI enters an overbought or oversold area and at the same time a reversal candlestick pattern is observed on the chart, the probability of trend reversal in the opposite direction will be very high. This overlap can give stronger signals to the trader and create more confidence in trading decisions.
Simultaneous Use of RSI and Complementary Indicators
Complementary indicators can increase the strength of RSI signals and especially help in identifying more precise entry and exit points. For example, combining RSI with Moving Averages (MA) or MACD can create more profitable signals. When RSI reaches one of the overbought or oversold areas and at the same time MACD issues a bullish or bearish crossover signal, this signal can indicate a strong trading opportunity. Also, combining RSI with volume analysis can help identify trend strength and detect price changes. If an RSI signal is accompanied by an increase in volume, this is typically considered a more valid signal for trend continuation.
Practical Examples of Combining Multiple Analytical Tools
One common example of combining RSI with other tools is using RSI along with support and resistance levels. When RSI reaches an overbought or oversold area and at the same point, the price hits a support or resistance level, this can indicate an imminent trend reversal. For example, suppose the price hits a key support level and RSI enters the oversold area. In this case, one can expect the price to move upward after touching this support level. This type of combination is especially useful for traders looking for short-term opportunities.
Optimal RSI Indicator Settings for Different Trading Styles
The default setting for RSI is usually 14 periods, which is standardly used by most analysts. These settings are generally suitable for most market conditions and produce high-accuracy signals. But these default settings are by no means suitable for all strategies and markets. For example, in volatile markets or with rapid price movement, shorter settings (such as 7 or 10 periods) may be needed to receive faster signals. In contrast, in markets with long-term trends, using longer periods (such as 21 or 30 periods) can lead to more accurate analysis.
Adjusting RSI for Short-term and Long-term Trading
For short-term trading, such as scalping or day trading, using shorter RSI periods can be useful. Settings of 7 or 10 periods can effectively provide quick and timely signals and react to market fluctuations. In these conditions, traders can quickly take advantage of short-term opportunities. In contrast, for long-term strategies or swing trading, using longer RSI periods, such as 21 or 30 periods, can increase the accuracy of signals and filter out unnecessary fluctuations.
How to Customize Settings Based on Strategy
Choosing the right settings for RSI largely depends on the trading strategy and the type of market. For example, if a trader wants to get more accurate signals for entry and exit, they can use a longer time period to prevent false fluctuations. In contrast, if the strategy is based on identifying fast and short-term movements, shorter settings can be more effective. Also, traders can use a combination of multiple RSI settings simultaneously to identify more precise entry points and reduce the risk of their trades.
Designing a Trading Strategy Based on the Relative Strength Index
The Relative Strength Index (RSI) can act as part of a comprehensive and effective trading system. Many traders use RSI as an important tool for identifying entry and exit points in the market. Since this indicator accurately analyzes price fluctuations, it can act as signals for buying and selling by identifying overbought and oversold areas. For example, when RSI reaches the level of 30 or less, it indicates oversold conditions and there is a possibility of price reversal upward. Conversely, when RSI reaches the level of 70 or more, it usually indicates an overbought condition and there is a possibility of price return downward.
RSI-based strategies can effectively help traders identify reversal trends and enter the market at sensitive points. However, RSI should not be used independently, but should be combined with other technical analysis tools such as support and resistance levels, candlestick patterns, and other indicators to provide more accurate and reliable signals.
Different Models of Using RSI in Trading
There are different strategies for using RSI that can help traders identify the best times to enter and exit. One of these strategies is using overbought and oversold areas. When RSI reaches above 70, it can be considered a signal to sell, as this area indicates that the market may have been over-purchased. Similarly, when RSI falls below 30, it can be a signal to buy, as this area indicates oversold conditions.
Another strategy is based on divergences. When the price of an asset reaches a new level, but RSI is unable to confirm this movement, this can be a sign of weakness in the trend and indicates the possibility of trend reversal in the opposite direction. This strategy can help identify trend changes in the early stages. Finally, using Failure Swing signals is also another famous strategy that is especially useful in identifying trend changes at specific time intervals.
Analysis of RSI Performance in Different Markets Including Forex
The use of RSI in different markets such as forex, stocks, and cryptocurrencies has differences. In the forex market, where price fluctuations usually occur in short-term time frames, using RSI with short-term settings can be more effective. In contrast, in stock markets where price changes may occur more slowly, longer-term settings for RSI can perform better.
Another advantage of RSI in the forex market is that given the specific characteristics of this market, such as the impact of economic news and political events, RSI can be used to identify short-term and medium-term opportunities. Given that forex is a volatile market, using RSI-based strategies can be particularly effective in volatile conditions.
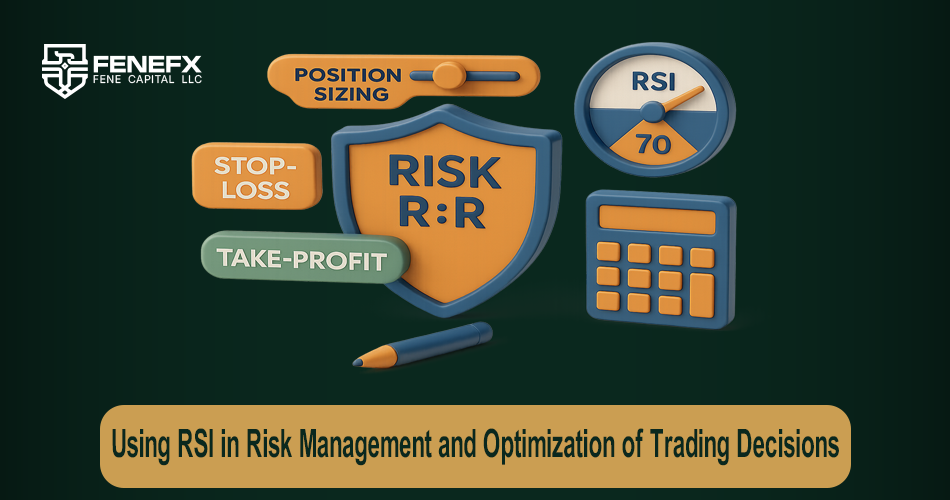
Using RSI in Risk Management and Optimization of Trading Decisions
Determining Entry and Exit Points Using RSI
One of the main applications of RSI in technical analysis is helping to determine optimal entry and exit points. This indicator can help traders make better decisions when an asset moves abnormally higher or lower than its natural range. For example, when RSI reaches above 70, this can be considered a sign of overbought, which probably means that the price will likely correct soon. In these conditions, traders can look to sell. Conversely, when RSI falls below 30, there is a possibility of trend reversal upward and this can be an opportunity to buy.
RSI signals can also be effectively used in combination with support and resistance levels. For example, when RSI enters the oversold area and at the same time, the price hits the support level, this combination can be a valid signal to buy. Similarly, when RSI enters the overbought area and the price hits the resistance level, this can be a signal to sell.
Signal Validation to Reduce Errors
One of the most important challenges of using RSI is reducing false signals. In some cases, RSI may give incorrect signals that lead to wrong trading decisions. For example, in prosperous and trending markets, RSI may remain in overbought or oversold areas for a long time without major price changes occurring. For this purpose, using other technical analysis tools to validate RSI signals is essential.
For example, combining RSI with other indicators such as MACD, moving average, or volume analysis can increase the accuracy of RSI signals. If RSI enters the overbought or oversold area and at the same time, another indicator such as MACD or moving average also gives a reversal signal, the likelihood that the trend will soon change will be higher. This combination can reduce the risk of false signals and especially in volatile market conditions, give more credibility to the analyses.
The Role of RSI in Controlling Emotions and Preventing Emotional Trading
One of the big challenges in trading is controlling emotions and avoiding making emotional decisions. RSI can also help traders as a psychological tool. Many novice traders tend to be influenced by their emotions such as fear or greed, and this can lead to wrong decisions. Using RSI as an unbiased and logic-based indicator can help traders prevent emotional trading. For example, when RSI reaches the overbought area, this signal can remind traders not to be influenced by greed and should be careful not to enter a buy trade at this point. Similarly, when RSI reaches the oversold area, it can be a reminder to avoid emotional decisions and identify an opportunity to buy.
Comments
Good primer. My two cents: the default 14 period isn't sacred. On lower timeframes I run RSI(7) for responsiveness and accept more noise. Test what fits your style.
One of the clearer RSI explainers I've read.
Would love a deeper article on RSI divergence — regular vs hidden. That part always confuses me.
I've had RSI on my charts forever without knowing what the 30/70 lines actually meant. This finally made it make sense, thanks a lot.
Shorted a rally purely because RSI hit 75 once. It stayed above 70 for two more weeks. Painful but valuable lesson about strong trends.