
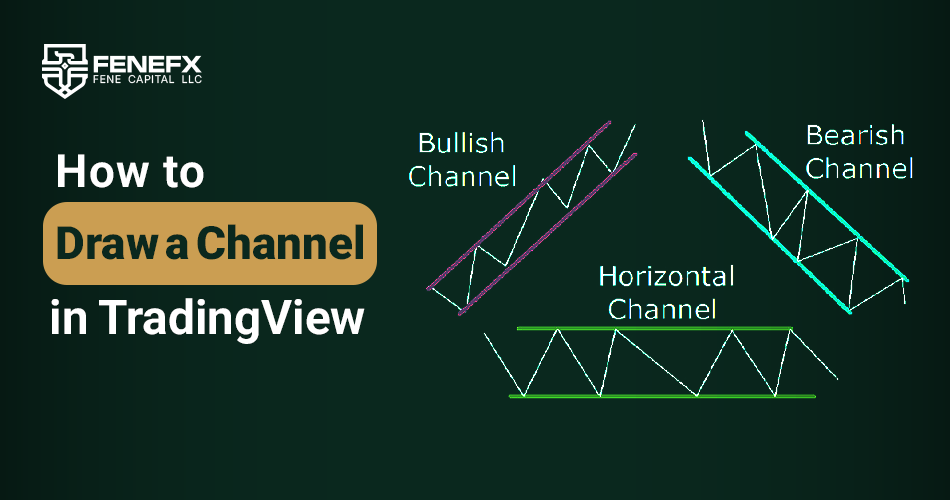
How to Draw a Channel in TradingView?
Drawing a price channel in TradingView is one of the most important skills that every technical analyst needs for a better understanding of market structure. Channels are visual tools that allow us to track the price movement in a defined and analyzable format. In TradingView, this task can be done easily with just a few clicks.
Accessing the Channel Drawing Tool
To start, you must first open the chart of the desired symbol in TradingView. Once the chart is open, drawing tools are located in the toolbar on the left side of the screen. To draw a channel, you should select the Parallel Channel tool. If this tool is not visible in the initial list, click on one of the trendline tools and select Parallel Channel from the dropdown list.
Three Point Channel Drawing
After activating the tool, the mouse pointer will change and become ready for drawing. First, click on one of the significant price lows or highs to mark the starting point. Then define the second point along the trend, and by clicking on it, the baseline of the channel will be created. In the third step, click on the opposite side to form the parallel line and complete the channel. For example, if you are drawing an ascending channel, place the first and second points on two price lows and the third point on a high.
Adjusting and Preparing for Analysis
After drawing the channel, you can freely move its lines, change the angle, or extend its length. One of the key features of this tool is theExtendoption. By using it, you can expand the channel lines infinitely across the chart. This option can be enabled by right clicking on the channel and going into theSettingssection. Other advanced settings, such as changing line color, line type, or displaying the median line, are also available in this section.
Correctly drawing a channel serves as the foundation for more precise technical analysis. Therefore, paying attention to selecting the correct lows and highs, choosing an appropriate time frame, and observing price reactions to the channel lines are all key aspects that should not be overlooked at this initial stage.
Introduction to the Parallel Channel Tool and How to Use It Properly

The Parallel Channel tool is one of the most precise drawing tools available on the TradingView platform. By creating two parallel lines, this tool visually defines the price movement range and is highly useful for trend analysis, examining price behavior in dynamic support and resistance zones, and even identifying potential reversal areas.
Structure and Function of the Channel Tool
The function of this tool is based on selecting three key points on the chart. By choosing the first two points, the base line is drawn, and the third point creates the second parallel line on the opposite side. This structure allows for observing price behavior within a channeled range, which is highly effective in analyzing trending markets and even sideways markets.
When using this tool, it is recommended first to identify the overall trend direction and then choose appropriate points for drawing. In upward trends, the baseline should be placed on price lows, and in downward trends, on price highs. The second line should then be completed by connecting a symmetrical point on the opposite side, defining the price movement range.
Professional Settings and the Median Line
One of the valuable features of the Parallel Channel tool in TradingView is the availability of advanced visual settings. In the Settings section, you can customize the color, line style (solid or dotted), and thickness of the lines. You can also enable the Median Line, which is highly useful for analyzing price behavior in the middle areas of the channel. This line can highlight short term reversals, price congestion zones, or intermediate movement targets more clearly.
When using multiple channels simultaneously on the chart, it is recommended to use different colors and lighter line styles to prevent visual clutter and maintain analytical clarity.
How to Precisely Adjust Channels for Higher Accuracy in Technical Analysis
Drawing a channel does not end simply by sketching two parallel lines. What distinguishes a professional analyst from others is the precision in adjusting the channel and using it within the real market context. In this section, several key tips for professionally adjusting channels are reviewed, which can significantly increase the credibility of your analysis.
Selecting Precise and Valid Points
To have a channel with high analytical validity, the starting and ending points of the base line must be selected from among lows or highs that the market has reacted strongly to. Using weak or random points results in a channel that is merely drawn in appearance and, in practice, holds no analytical value.
The higher the timeframe in which these points are chosen—such as daily or four hour—the greater their predictive power and credibility. Also, using peaks and troughs that are accompanied by high volume and impulsive candles supports the accuracy of the channel.
Using the Extend Feature and Locking Lines
The channel tool in TradingView offers the ability to extend lines. By enabling this feature, channel lines will stretch infinitely to the right of the chart. This feature is very useful for forward looking market analysis and identifying price targets or reaction zones along the projected price path.
Additionally, with theLockoption, you can lock the channel lines after the final adjustment so that they do not accidentally shift during analysis or when moving the chart. This feature helps maintain visual accuracy and prevents disruption in the analytical structure.
Using the Channel as a Dynamic Support and Resistance Structure
One of the most important uses of a channel in technical analysis is examining price behavior within the framework of moving support and resistance. The lower edge of the channel usually acts as support, while the upper edge serves as resistance. Breaking through these boundaries (channel breakout) can signal trend continuation or reversal.
Professional analysts use the price reaction to channel lines to determine entry and exit points or to set stop loss levels. Also, the channel’s median line is often used as a behavioral axis for temporary pullbacks or to confirm trend continuation.
The Difference Between Ascending, Descending, and Neutral Channels in Chart Analysis
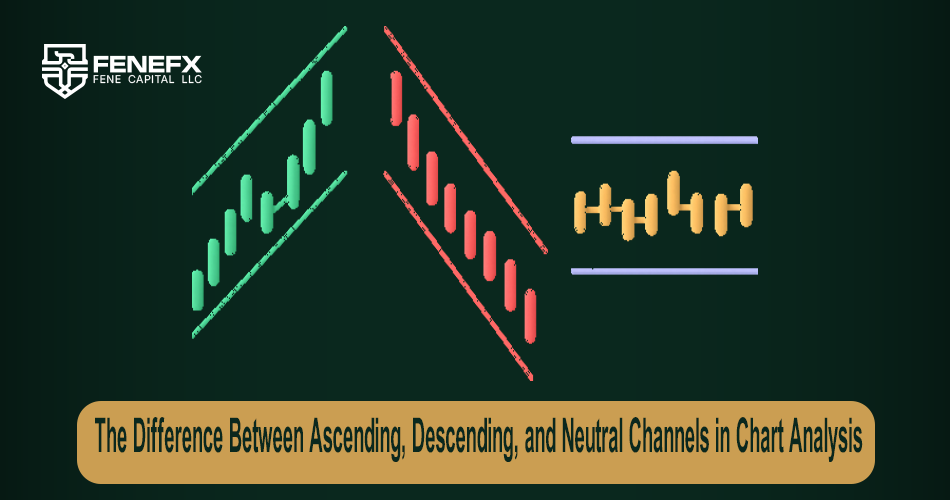
In technical analysis, identifying the overall market structure is one of the most important responsibilities of an analyst. Price channels are an effective tool for understanding this structure. However, to use this tool effectively, one must first become familiar with its different types. Channels are generally divided into three main types: ascending, descending, and neutral.
How Do Channels Reveal Market Structure?
An ascending channel forms when the price creates higher highs and higher lows over time. In such conditions, the lower line of the channel serves as dynamic support, and the upper line acts as moving resistance. In uptrends, a common strategy is to buy when the price touches the bottom of the channel and sell near its top. If the price strongly breaks through the top of the channel, it indicates increased bullish momentum.
In contrast, a descending channel indicates a gradual decline in price. This structure is composed of lower highs and lower lows. In this case, sellers dominate the market, and selling near the top of the channel is more common. A breakdown through the bottom of the channel serves as a stronger signal for continuation of the downtrend.
Neutral channels represent an intermediate state. In this structure, the price fluctuates between two horizontal lines, and no clear long term trend is observed. This situation typically occurs during market consolidation phases. A neutral channel provides suitable opportunities for traders who aim to buy at support and sell at resistance. However, one must be cautious of breakouts in either direction, as such breakouts often mark the beginning of a new trend.
Recognizing these three types of channels and being able to distinguish between them enables the analyst to better understand the underlying market structure and adjust their strategy accordingly.
Common Mistakes in Drawing Channels and How to Avoid Them
Although drawing a channel may seem simple at first glance, mistakes in this process can completely divert the analysis from its intended path. Many traders, instead of using channels to better understand the trend, confuse themselves by drawing them incorrectly.
What Makes a Channel Valid?
One common mistake is selecting invalid points to start drawing the channel. For example, if the low or high used for drawing has not shown a clear price reaction or the trading volume in that area was low, the resulting channel will not accurately reflect market behavior. A valid point must have been touched multiple times by price in the past and must have led to a reversal.
Drawing Channels in Very Low Timeframes
Another mistake is drawing channels on very low timeframes. In such timeframes, fast fluctuations and price noise can distort the shape of the channel and lead the analyst to trust false signals. It is better to use time frames of 15 minutes and higher to draw channels with stronger analytical value.
Illogical Channel Slope
Another mistake is using an illogical channel slope. Some traders tend to draw lines with extremely steep or extremely shallow angles, which do not match the actual price movement. A valid channel must align with the prevailing trend and momentum of the market and should correctly frame price action.
To ensure the validity of a channel, it should always be reviewed across multiple timeframes. Checking touchpoints, the market's reaction to channel boundaries, and reviewing past responses are among the key techniques that help prevent analytical errors.
Combined Techniques for Professional Use of Channels in Price Analysis

A channel, by itself, is a powerful tool for understanding price behavior, but when used alongside other technical analysis tools, its effectiveness multiplies. Combining the channel with tools such as Fibonacci, supply and demand zones, or candlestick patterns can provide the analyst with a multidimensional understanding of market conditions.
How to Turn a Simple Channel into an Advanced Analysis
One of the most practical methods is the simultaneous use of the channel and the Fibonacci tool. After drawing the channel, Fibonacci retracement levels can be plotted within it to identify potential price reversal areas. If a Fibonacci retracement level intersects with the top or bottom of the channel, that point can be a strong area for entry or exit.
Examining Overlaps in Touch Points
The next combination involves examining overlaps between the price's contact points with the channel boundaries and supply and demand zones. If the price reaches the upper line of the channel and simultaneously encounters a strong supply zone, the likelihood of a reversal increases. This overlap enhances the credibility of both the channel and the analytical zone, reducing decision making risk.
Using Candlestick Patterns
Finally, using candlestick patterns at the points where price touches the channel boundary can serve as strong confirmation for entry or exit. Observing patterns such as pin bars, engulfing, or doji at the contact point with the bottom or top of the channel can give more credibility to the signals and make entry timing more precise.
When these tools are combined carefully, the channel transforms from a simple visual tool into a powerful analytical framework that can serve as the foundation of the analyst's trading strategy.
Comments
Could you do a follow-up on regression channels? Not sure when to prefer them over hand-drawn ones.
Decent guide. One tip: toggle log scale when drawing channels on higher timeframes, otherwise long trends look bent and your channel lies to you.
Clean walkthrough, the screenshots helped a lot.
Spent my first month forcing channels onto everything. Half of them were imaginary. These days if I need more than two clean touches to justify it, I just don't draw it.
New to charting and I always wondered how people got their channels perfectly parallel. Didn't know about the dedicated tool — I was drawing two separate trendlines like a caveman. Thanks!