





Weekly Financial Markets Outlook: October 27 - November 2
The US dollar showed no significant change last week following the release of a lower than expected Consumer Price Index (CPI) report, with the Dollar Index (DXY) closing in the $98.90 range. The data indicated that consumer prices grew by only 0.3% in September, whereas the market had anticipated a 0.4% increase. This figure led to a full market pricing in of a potential rate cut at the Federal Reserve's meeting next week. Despite this, the dollar recouped some of its initial losses, suggesting that investors are still awaiting confirmation of Powell's final tone before exiting their dollar positions.
The US Dollar on the Eve of the Fed Decision: The Calm Before the Storm
In the global arena, positive data from the Eurozone resulted in a limited rise in the Euro to the $1.1625 level, while the British Pound returned to the $1.3312 range after an initial surge driven by strong retail sales. In East Asia, the Japanese Yen weakened, falling to 152.78 against the dollar, a development attributable both to rising oil prices following new sanctions on Russian companies and the expansionary policies of Japan's new government. Meanwhile, Donald Trump's remarks about halting trade talks with Canada and his plan to meet with Xi Jinping in South Korea have once again drawn market attention to the geopolitical axis and global trade.
Looking ahead to the coming week, all market focus will be on the Federal Reserve meeting and the release of the Core PCE index on Friday. The market is nearly certain that the Fed will cut the interest rate to the 3.75% to 4.00% range, but the subsequent path remains unclear. If Jerome Powell emphasizes data dependency in his press conference and refrains from offering further expansionary signals, the dollar may strengthen again as a safe haven asset. Conversely, if the meeting's message underscores a continuation of expansionary policy, it could trigger a new wave of dollar weakness and growth in riskier currencies such as the Euro, Pound, and Australian Dollar.
In summary, the Dollar Index is currently on the verge of the $98.50 support zone, and any sustained break below this level could pave the way for a deeper correction towards the $97.80 - $97.50 range. On the other hand, a rebound back above the $99.20 level could signal the preservation of safe haven capital flow and the dollar's return to a short term uptrend. Given the high volume of events in the week ahead, it can be said that the foreign exchange market is poised on the brink of a period of significant, decision making volatility.
Gold's Retreat from the Brink: Is the $4000 Support Level the Birthplace of a New Uptrend?
The nine week consecutive ascent of gold finally came to a halt last week, with the yellow metal facing a drop of approximately 3.5%. Despite the relatively sharp decline early in the week, the $4000 support level managed to prevent further selling pressure, and the gold price ultimately closed about $100 above this key level. The recent correction can be attributed to severe overbought conditions and profit taking by traders, while weaker than expected US CPI data also reduced gold's appeal as an inflation hedge. Nevertheless, holding the $4000 support is considered a positive sign during a turbulent week for the precious metal.
In the short term outlook, US China trade talks and a series of major central bank meetings (including the Federal Reserve and the Bank of England) will play a key role in determining gold's next direction. Renewed expectations for expansionary policies, particularly from the Bank of England following weak inflation data, could partially support gold prices. Conversely, any hawkish and restrictive tone from the Federal Reserve might impose another temporary pressure on the market. Furthermore, the US dollar's recovery last week was also one of the reasons for gold's decline; therefore, if the dollar weakens again, gold could recoup some of its recent losses.
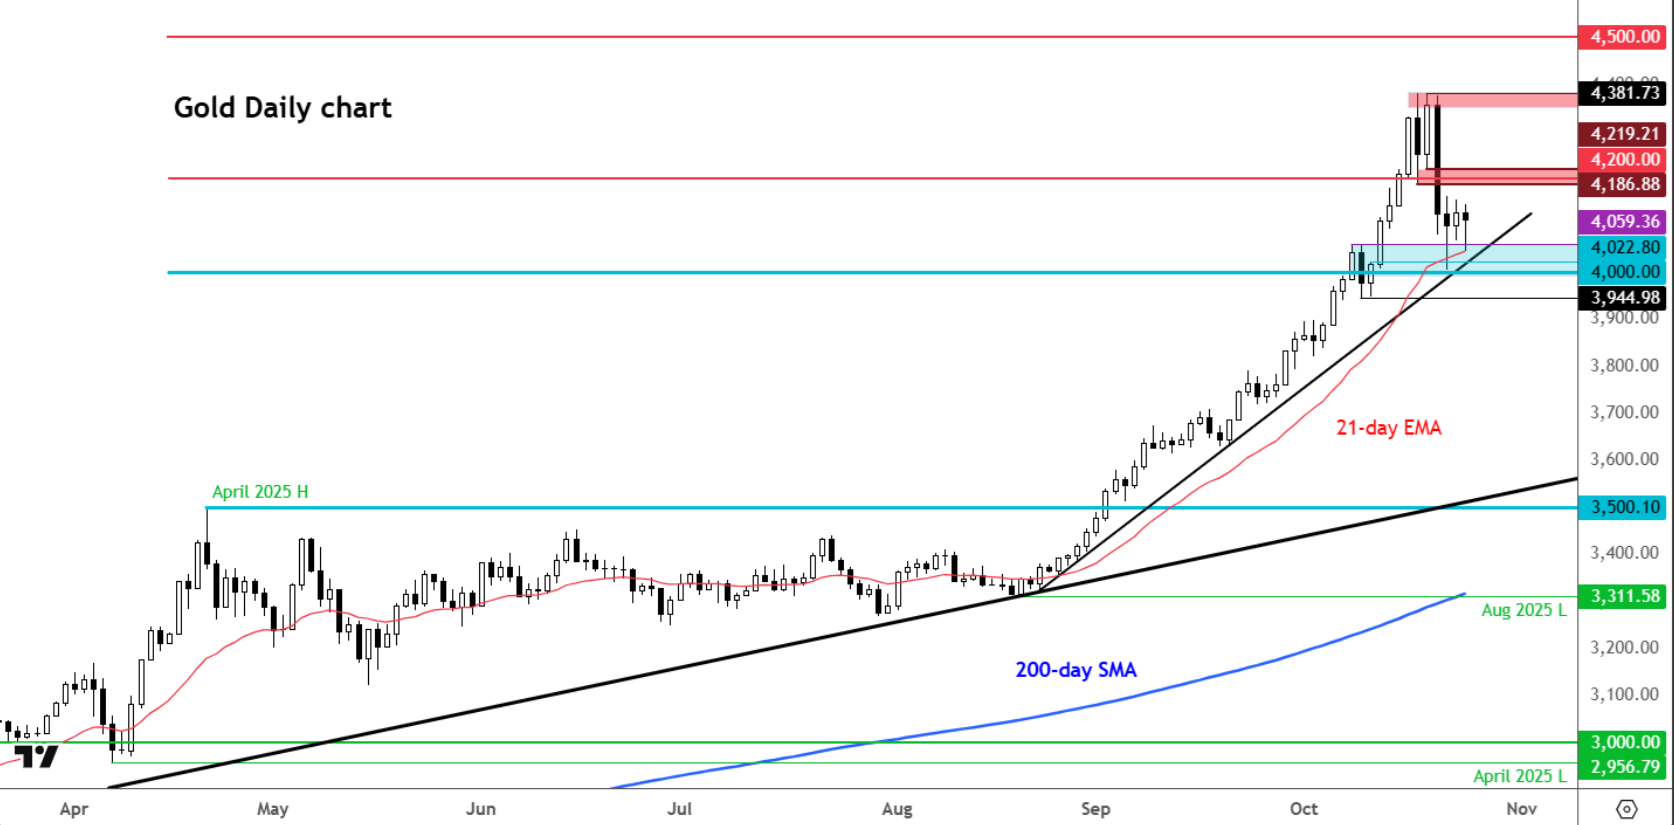
From a technical perspective, as long as the $4000 area is maintained, the overall trend structure is still assessed as bullish. The first resistance lies in the $4200 range, and a sustained break above it could signal the return of buying power and the start of a new uptrend phase. Conversely, breaking the $4000 level will likely lead to additional selling pressure and a deeper correction to lower levels. Given that many investors missed the previous rally, any short term correction can be considered a re-entry opportunity for mid term buyers.
Weekly Silver Analysis: Retreat from Peaks on the Eve of the Federal Reserve Decision
Silver finally entered a correction phase following a spectacular six month rally. The price of silver (XAG/USD) closed last week with a drop of over 6% in the $48.67 range, halting its nine week consecutive uptrend. This decline occurred as the market reached a repricing phase after the rapid ascent from the $28.31 low to the $54.49 peak. The primary cause of the recent correction can be traced to the easing of physical supply shortage pressures in London and the exit of speculators from high risk trades factors that were previously the main fuel for silver’s parabolic rise.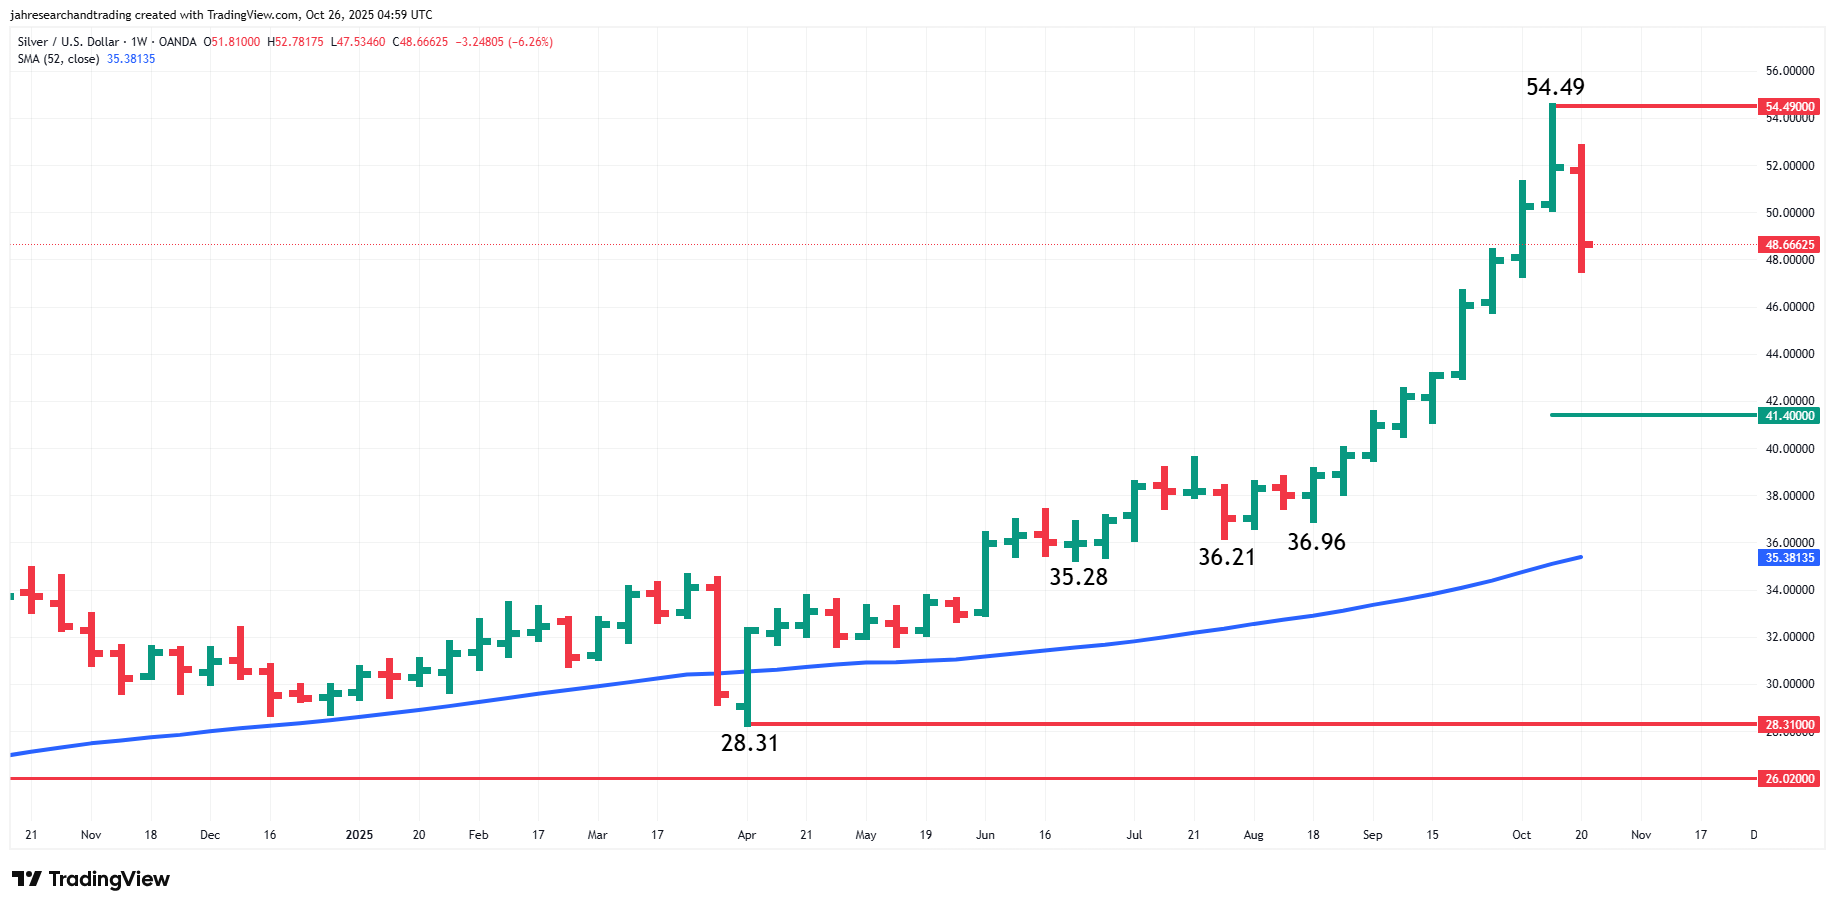
According to new reports, over 1,000 tonnes of silver have been transferred from the United States and China to replenish empty London vaults. This action led to a reduction in borrowing costs and a drop in the cash premium on the market, consequently removing one of the most crucial drivers of the recent ascent. Concurrently, the decline in gold prices and uncertainty regarding the Federal Reserve's future policy direction have also exerted additional pressure on silver. Although weaker US inflation data (CPI) have strengthened the probability of a rate cut at the October meeting, the absence of a clear outlook for continued expansionary policy has led investors to enter the market with caution and hesitation.
From a technical perspective, the recent decline is considered the first serious correction after an approximately 93% rally from the April lows. The $41.40 level, which corresponds to the 50% Fibonacci retracement, is considered the first significant support area, followed by the $38.31 level as the 61.8% Fibonacci support. In the bearish scenario, a decline to the long term level of $35.38 is also possible. Until the Federal Reserve provides a clear path for future policies, the short term outlook for silver remains bearishly inclined. However, should Powell provide a strong expansionary signal, institutional buyers could be expected to re-enter the market from these attractive price areas, triggering a new wave of demand.
Wall Street Rally on the Eve of the Fed Meeting: Historic Highs with a Pinch of Caution
The US stock market concluded last week by setting new historic highs. Both the S&P 500 and Nasdaq 100 indices opened with a bullish gap in Friday's trading, and this gap was not filled by the end of the day, signaling strong demand following the release of the lower than expected Consumer Price Index (CPI) report. Despite recent concerns about tariffs and the ongoing US government shutdown, investors are still focused on the Federal Reserve’s monetary policy, which is widely expected to cut interest rates at this week's meeting. These expectations, combined with controlled inflation, have sustained the powerful rally since the April correction.
However, experienced traders know that the upcoming Fed meeting could be a critical moment for the market trend. During the last rate cut in September, the market initially reacted negatively and then opened with a bullish gap the following day, whereas in the July meeting, Powell's ambiguities about the continuation of the cutting cycle led to a widespread correction in the indices. Therefore, Powell’s tone at this week's press conference will likely determine the short term direction of the market. From a technical perspective, a Rising Wedge pattern has formed on the S&P 500 daily chart, which is typically a sign of a potential temporary correction. Key support levels are in the 6738 to 6772 range (Friday's bullish gap) and subsequently at 6550; as long as these levels are maintained, the market bias will remain bullish.
In the Nasdaq 100 Index, we also witnessed a bullish gap and the registration of a new historic high. This move stems from the breakout of an Ascending Triangle pattern that had formed around the 25,180 unit resistance level. Now, this same 25,180 range can act as a key short term support. Should this level be maintained, the uptrend could continue, with the next targets placed in the 25,600 to 25,900 unit range. However, if the support breaks, a correction to lower ranges is possible, especially if the Federal Reserve's signals are less "expansionary" than anticipated. Overall, prior to the announcement of the Federal Reserve's decision and the release of the Core PCE index, the prevailing direction in the stock market is assessed as positive yet fragile.
Cryptocurrency Market in Waiting Phase
The cryptocurrency market concluded last week with high volatility and a lack of clear direction. Following the two stage correction in October, Bitcoin managed to form a temporary floor in the $106,500 range, which is equivalent to the 38.2% Fibonacci retracement level of the bullish wave from April to October. Despite holding this area, the 20 day Average True Range (ATR) has reached its six month high, indicating an unprecedented increase in the amplitude of fluctuations. Behaviorally, the market has shifted from a corrective phase to a consolidation phase, but the energy stored within this range could set the stage for a new breakout in the coming weeks.
From a correlation perspective, recent data shows that the correlation between large and medium sized cryptocurrencies and Bitcoin has increased over the 20 day period, a phenomenon that typically occurs less frequently during ranging phases. This suggests that traders are following the direction of Bitcoin as the main market index, rather than focusing on the independent flows of each coin. Meanwhile, the ETH/LTC pair has shown a weaker correlation (around 0.798), which is due to the difference in the intensity of volatility. Ethereum experienced a milder decline than Litecoin in the recent correction and is now consolidated within a Wedge pattern with a bullish bias, while Litecoin has recently broken above its trendline, showing signs of a gradual return of buyers.
In the technical section, Bitcoin is currently oscillating between the $116,000 resistance and the key support of $106,500. A daily close below the $106,500 level could signal the re-activation of selling pressure and a move towards the next support at $103,500, whereas a sustained break above $116,000 could pave the way for a return to the bullish phase. Among altcoins, Dogecoin (DOGEUSD) has a similar structure but with a wider range of fluctuation. The $0.2150 level is considered the mid term resistance and $0.17 is the floor of the 13 month bullish channel; breaking either of these levels could signal a significant phase change in the crypto asset’s behavior.
Overall, cryptocurrencies have entered a period of consolidation and anticipation, where the market's next direction depends on two key factors:
1️⃣ The Federal Reserve's tone at the upcoming meeting, which directly affects the liquidity flow into risk assets.
2️⃣ The strength of Bitcoin's correlation with US stock indices (especially the S&P 500), which typically strengthens during periods of high risk on sentiment or uptrends.
Should confidence return to risk markets, the probability of a bullish breakout from the current ranges is high; however, in the cautious scenario, consolidation below $106,000 could be a prelude to a deeper correction towards the $103,000 vicinity.
China’s Oil Stockpiling and Russia Sanctions: Market on the Verge of Sustained Oversupply
Oil prices remained under pressure from high supply last week, despite occasional fluctuations. A new report by the Bernstein Institute indicates that China has added over 100 million barrels of oil to its reserves since the beginning of the year, and the country's total oil reserves now stand at approximately 1.38 billion barrels equivalent to 112 days of imports. Of this amount, about 500 million barrels are held in the government's Strategic Petroleum Reserve (SPR), to which another 150 million barrels are expected to be added as long as Brent prices remain below $70.
However, Bernstein strategists emphasize that the "golden era of China's oil demand growth" is over. Domestic consumption growth this year is estimated to be only about 1% (equivalent to 0.1 million barrels per day), as the increasing share of electric vehicles and improvements in energy efficiency have reduced the actual growth of fuel consumption. In other words, China's high imports in recent months have been driven more by reserve building than by an increase in actual consumption. While this trend provides short term support to the market, it cannot fully absorb the global oversupply.
Currently, global production is about 2 million barrels per day greater than demand, and even with the continuation of oil purchases for China's strategic reserves (approximately 0.4 to 0.5 million barrels per day), a net surplus of close to 1 million barrels per day will remain in the market. A significant portion of this volume, about 1.4 million barrels per day, is currently flowing into OECD country inventories as well as floating storage. Meanwhile, new US sanctions against Rosneft and Lukoil due to the war in Ukraine caused a momentary spike in oil spot prices but do not have a sustained impact on the supply trend unless Russian exports are perceptibly disrupted.
From a weekly outlook perspective, the oil market continues to face the risk of oversupply. Should the weakness in Asian demand growth persist and high production from OPEC+ be maintained, the price of Brent crude is likely to return to the $65 to $68 range. Conversely, any sign of voluntary supply cuts or an escalation of geopolitical tensions in the Middle East could be a temporary driver for price growth into the $73 to $75 range. Until a genuine balance between supply and demand is established, the overall market trend is assessed as Neutral to Bearish.
Comments
How do you suggest handling open swing positions going into a Fed decision — hedge, close, or just widen stops? Would make a great standalone article.
Good coverage. One addition: month-end flows collide with FOMC this week, so moves may extend well beyond the initial reaction. Size down accordingly.
Concise and on point as usual, cheers.
Last FOMC I held a position through the announcement out of stubbornness. Never again. Weekly previews like this are now part of my prep.
Central bank week used to be pure chaos for me. Your breakdown of what each meeting could mean for the dollar finally gives me a framework. Thank you!