


What is BMS in Forex?
BMS, or Break of Market Structure, is a key concept in technical analysis in the Forex market that highlights significant changes in price trend structures. In short, BMS signals to traders that the current market order is broken, indicating a potential trend reversal or consolidation. Correct identification of BMS allows traders to optimize entry and exit points, reduce risk, and better leverage market fluctuations. This article will further explore the types of BMS, how to identify them, and their practical application in trading strategies, enabling traders to use this essential tool effectively.
Definition of Break of Market Structure (BMS)
A Break of Market Structure (BMS) occurs when the price moves beyond a specific pattern or level that previously defined the trend. For example, in an uptrend, if the price fails to break the previous high and instead starts moving downward, a bearish BMS is formed. Conversely, in a downtrend, when the price breaks below the previous low, it signals a bullish BMS. This concept indicates that the previous trend has weakened, and the market is preparing for either a reversal or a new consolidation phase.
BMS is usually identified using a combination of technical tools such as trendlines, support and resistance levels, and candlestick patterns. Paying close attention to the details of these breaks including the size of the move, trading volume, and timeframe can provide traders with more reliable signals.
The Role of BMS in Technical Analysis
In technical analysis , Break of Market Structure (BMS) plays a crucial role in identifying market turning points. When a market structure is broken, traders can recognize that the current trend may be weakening and that it is time to adjust their strategies.
BMS acts as an early warning signal, preparing traders to evaluate other factors such as resistance levels, support zones, and continuation patterns. Simply put, BMS enables analysts to anticipate market changes before a new trend is fully established, helping them make better informed trading decisions.
Types of BMS and Their Signals in the Market
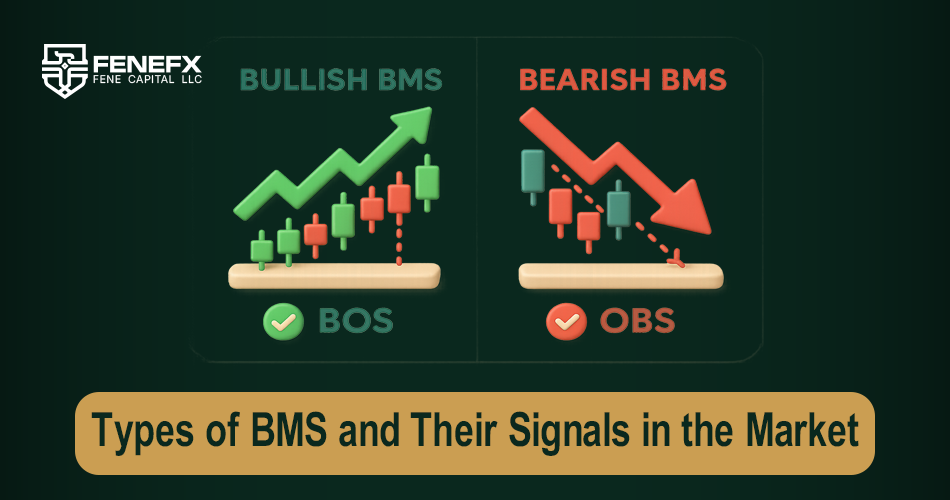
BMS can occur in different types of markets, and depending on the direction of the break, it has different characteristics. Understanding its types is essential for every trader, because each type of BMS provides a different signal about the market trend, and the trading strategy must be adjusted based on the type of break.
Bullish and Bearish BMS
A bullish BMS occurs when a downtrend is broken and the price moves above the previous low. This is a sign of buyers’ strength and the potential start of an uptrend. Traders can enter long positions by observing this pattern and benefit from the possible price increase.
Conversely, a bearish BMS forms when an uptrend is broken and the price falls below the previous low. This situation indicates sellers’ strength and the potential beginning of a new downtrend, where traders can profit by entering short positions.
Indicators and Candlesticks
Identifying Break of Market Structure (BMS) is not limited to observing a price level break. Technical indicators such as trading volume, moving averages, RSI, and MACD can provide important confirmations for the occurrence of BMS. Key candlesticks especially strong bullish or bearish candles with long bodies and short wicks are often signs of a valid break.
Combining these indicators with the analysis of multiple timeframes helps traders filter out false signals and make more accurate trading decisions.
How to Identify BMS?
Identifying a Break of Market Structure (BMS) requires a careful examination of price levels and previous trends. A trader must be able to recognize key support and resistance levels, trendlines, and chart patterns in order to determine the right time to enter or exit the market.
Analyzing Support and Resistance Levels
Support and resistance levels are among the most important tools for identifying BMS. When the price breaks a major support level, a bearish BMS is likely to occur, and the trader can prepare to enter a short position. Conversely, when the price breaks a significant resistance level, it usually signals a bullish BMS and creates an opportunity to go long.
Carefully analyzing how price reacts to these levels, along with the trading volume accompanying the break, is the key to successfully identifying BMS.
Trendlines and Key Breakouts
Trendlines act as the roadmap of the market, showing the direction of price movement. When the price breaks a trendline, this breakout can be the first sign of a Break of Market Structure (BMS).
Combining trendline breakouts with other tools such as candlestick patterns and technical indicators strengthens the validity of the signal. Professional traders usually wait for confirmation of the breakout and price consolidation after the break, in order to minimize errors and make more reliable trading decisions.
Using BMS in Trading Strategies
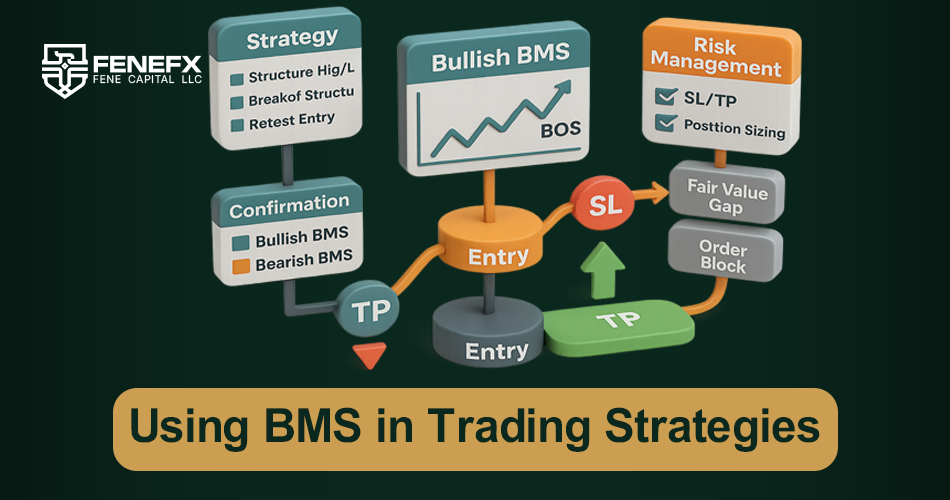
Break of Market Structure (BMS) is an important tool for designing trading strategies in Forex. Correctly identifying these breaks allows traders to find optimal entry and exit points while reducing trading risk. BMS is not a standalone signal but rather an early warning that should be combined with other technical tools to gain stronger confirmation. Successful trading strategies are usually built on the identification of BMS, support and resistance levels, market trends, and complementary indicators.
The practical use of BMS in trading enables traders to base their decisions on logical analysis rather than guesswork. Professional traders analyze BMS alongside trading volume, oscillators, and candlestick patterns to distinguish real breaks from false signals. Therefore, BMS can serve as a foundation for carefully planned trading strategies, helping traders maximize profits from both bullish and bearish market trends.
Combining BMS with Indicators and Candlestick Patterns
To increase the accuracy of Break of Market Structure (BMS), traders often use technical indicators such as RSI , MACD, and moving averages. These indicators can show the strength of market momentum and the likelihood of trend continuation after a structural break. For example, if a bullish BMS occurs while the RSI is in the oversold zone, this combination suggests that the market is ready for an upward move and a long position can be opened.
Candlestick patterns also play a vital role in confirming BMS. Strong candles with long bodies and short wicks, combined with a breakout of a key level, indicate genuine market movement. Combining BMS with candlestick patterns can protect traders from false signals and provide greater confidence when entering a trade.
Setting Stop Loss and Take Profit with BMS
Break of Market Structure (BMS) is also a useful tool for setting stop loss and take profit levels. After identifying a structural break, traders can place the stop loss at a level where the break has not been confirmed, usually near the closest support or resistance level before the BMS.
For take profit, the next resistance or support levels can be considered, allowing traders to calculate an appropriate risk to reward ratio. This method helps ensure trades are executed in a more organized and risk controlled manner, reducing the chances of early exits or heavy losses.
If you are looking for a professional start in Forex trading without risking your personal capital, purchasing prop from Prop Fenefx can be an ideal starting point. By using Fenefx’s allocated capital, you can focus on learning and executing trading strategies while benefiting from platform support to enhance your performance. This opportunity allows you to gain real market experience and elevate your skills to a professional level without financial pressure.
Practical Examples of BMS in Forex
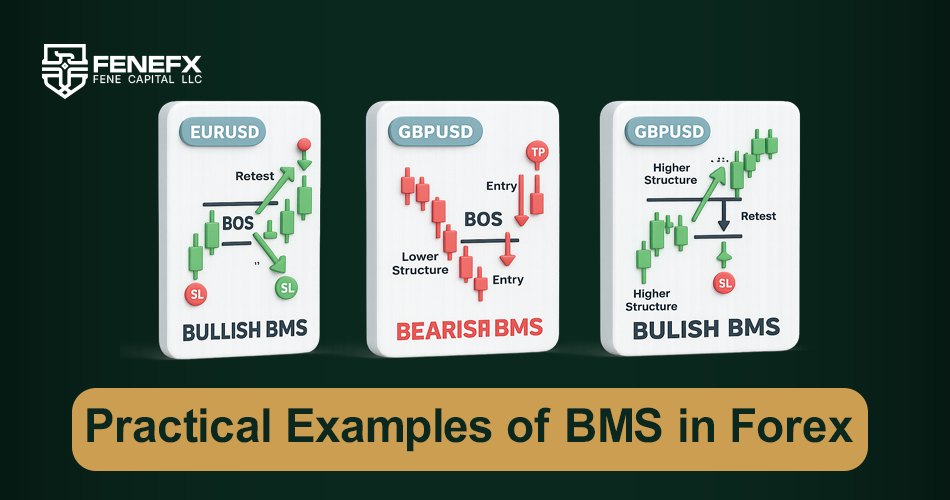
To better understand the application of Break of Market Structure (BMS), reviewing real market examples in Forex is highly important. These examples help traders see how to identify structural breaks, set stop loss and take profit levels, and combine BMS with other technical tools in practice.
Example of a Real Trade in an Uptrend
Imagine the EUR/USD pair is in an uptrend, and the price has tested the previous high several times but failed to break it. Eventually, the price breaks above this resistance with strong bullish candles, forming a bullish BMS.
The trader can confirm this breakout using indicators such as RSI and moving averages, and then enter a long position. The stop loss is placed at the previous support level, while the take profit is set based on the next resistance or a suitable risk to reward ratio. This method allows the trader to take advantage of the beginning of a new trend with a high probability of success.
Example of a Real Trade in a Downtrend
In another example, the GBP/USD pair is moving in a downtrend. After several attempts to hold the support level, the price eventually breaks below it, forming a bearish BMS.
The trader confirms the breakout by analyzing trading volume and oscillators, then opens a short position. The stop loss is placed at the highest point before the BMS, while the take profit is determined based on the next support level or a specific percentage of the price movement.
This example illustrates how BMS can create profitable trading opportunities in bearish market trends.
Key Points and Common Mistakes Traders Make with BMS
Using Break of Market Structure (BMS) requires precision and experience, and beginner traders may often make common mistakes. Understanding these key points and pitfalls can help prevent unnecessary losses and improve overall trading performance.
False Signals and Risk Management
One of the most common mistakes is relying too heavily on BMS without confirmation from other indicators. False breaks or fake breaks can lead traders into losing positions. To reduce this risk, it is recommended to combine BMS with technical indicators, trading volume, and candlestick patterns, while managing each trade with a logical stop loss.
In addition, using multiple timeframes to analyze breakouts can further reduce the chance of entering false trades.
Psychological Factors and Emotion Control
Psychology plays an important role in using Break of Market Structure (BMS) effectively. Traders often make emotional decisions driven by fear or greed, causing them to deviate from their trading plan. To succeed with BMS, it is essential to maintain discipline, patience, and wait for proper confirmation of breakouts.
Managing position size, setting appropriate stop loss and take profit levels, and sticking to a predefined strategy can help prevent stress and emotional decision making. With consistent practice, traders can use BMS as a reliable tool for market analysis and take advantage of profitable opportunities.
Incorporating BMS into Forex trading strategies can help traders make more logical and well informed decisions, control risks, and increase profitability. Combining BMS with indicators and candlestick patterns, setting precise stop loss and take profit levels, analyzing real market examples, and applying psychological discipline paves the way for trading success.
Traders who carefully study and apply BMS will be able to identify valuable opportunities in both bullish and bearish trends and leverage market volatility to their advantage.
Conclusion
BMS is an essential tool for precise Forex market analysis, helping traders better understand trends and make informed trading decisions. Proper use of BMS, combined with technical indicators, support and resistance levels, and candlestick patterns, enhances profitable opportunities and reduces trading risk. Traders who study and apply this concept carefully can leverage market fluctuations to their advantage and develop successful, disciplined trading strategies.
FAQ (English)
1.What is BMS and why is it important?
BMS indicates a break in market structure, alerting traders to a potential trend reversal or price consolidation.
2.How can BMS be identified?
BMS can be identified by examining support and resistance levels, trendlines, key candlesticks, and technical indicators.
3.How does BMS help in risk management?
BMS helps reduce trading risk and prevent unwanted losses by determining optimal entry and exit points.
4.How to use BMS in a trading strategy?
By combining BMS with indicators, candlestick patterns, and proper stop-loss and take-profit levels, traders can design successful and disciplined strategies.
Comments
Could you do a follow-up on how brokers use the BMS for risk management? I'm curious how they decide which clients get A-booked vs B-booked.
I worked support at a small brokerage for a year and the BMS was basically our entire day. Funny how few traders even know it exists.
Decent overview, but worth noting most retail traders never interact with a BMS directly. Where it matters is execution quality — a broker with a clunky BMS usually shows it in withdrawals and support speed.
Thanks for this! I kept seeing BMS mentioned in broker reviews and had no idea it was the system running behind the scenes. Finally makes sense why account issues get 'escalated to the back office'.
Short and to the point, nice one. Cleared it up in two minutes.