




What Is Candlestick Analysis in Forex?
Candlestick analysis is one of the most important skills that every Forex trader needs in order to understand the true behavior of the market. Behind every candlestick lies a story of the confrontation between buyers and sellers which, if read correctly, can reveal the best entry and exit points, and even potential trend reversals. Many traders focus only on the appearance of patterns, but those who can understand the nature of candlesticks identify liquidity flow and market sentiment more accurately than others. In this article, we examine all the essential candlestick concepts in simple and practical language so that you can enter trades with a more professional perspective and make more informed decisions.
What Is a Candlestick?
A candlestick , or candlestick chart, is a method of displaying price that shows four key price values within each time interval (timeframe): the opening price (Open), the highest price (High), the lowest price (Low), and the closing price (Close). Every “candle” or candlestick consists of a body and one or two shadows, and the combination of the shape, size, and color of these elements provides traders with immediate information about buying and selling pressure, market direction, and the level of confidence among market participants.
In Forex, the candlestick is a primary tool for reading price behavior because it clearly reflects short term fluctuations and produces recurring patterns that are highly practical for identifying entry and exit points, managing risk, and detecting trend reversals.
Definition and Main Elements of a Candlestick
Body:
The body represents the difference between the opening price and the closing price. A long body indicates a strong move in the direction of the candlestick, while a small body reflects hesitation or a balance between buyers and sellers.
Wicks / Shadows:
These indicate the highest and lowest prices reached during the candlestick’s time period. A long upper wick shows selling pressure at that high, and a long lower wick indicates buying pressure at that low.
Color / Direction:
Typically, a bullish candlestick (closing price higher than opening) is displayed in green or white, and a bearish candlestick (closing price lower than opening) is shown in red or black. The color is merely a visual representation; more important than color are the ratio of the body to the shadows and the candlestick’s position within the trend.
A Brief History and the Reason for Its Importance in Forex
The candlestick was first developed in Japan for analyzing rice prices, and it became popular due to its high readability and its ability to quickly convey market emotions (fear and greed). In the 24 hour Forex market, candlesticks are highly practical because they clearly display continuous movements and the microstructure of price especially for traders who rely on price action and market structure analysis.
Why Candlesticks Are Better Than Line or Bar Charts
A line chart displays only the closing price in each interval, losing much of the psychological and emotional information of the market. A candlestick describes the same interval using a body and shadows, allowing traders to read the “story” of that time period: who was in control, whether a reversal pressure occurred, and whether the movement was strong or weak.
How to Read Candlesticks (Initial Reading)
Reading a candlestick means quickly interpreting the body, the shadows, and the candlestick’s position relative to previous candles and the overall market structure. The goal is to understand what decision the market has made at that moment and what the potential next moves might be. In the initial reading, you should focus on four main aspects: body size, shadows, the candlestick’s position within the trend, and the timeframe. This reading must be combined with the concept of “context” the broader market environment to avoid false signals.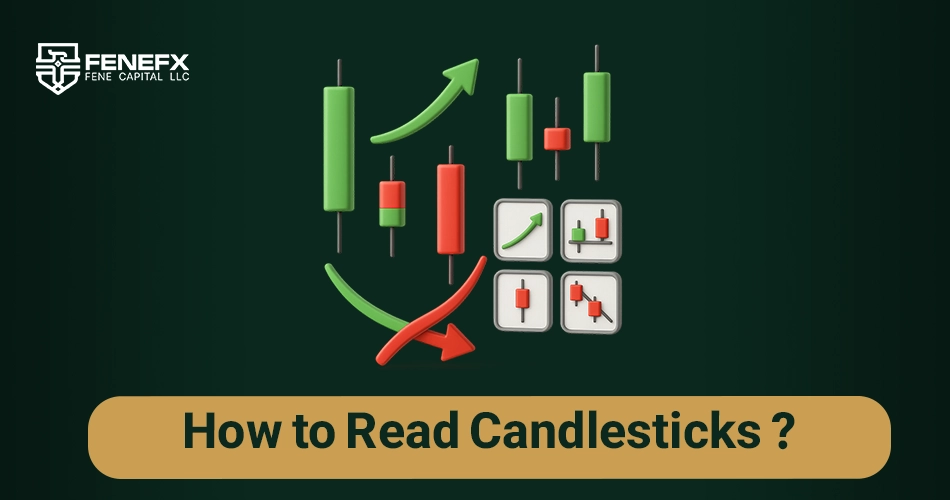
Body Size and Its Meaning
Long Bullish Body:
Buyers have been strong; the probability of a continued upward move is higher unless the price encounters significant resistance.
Long Bearish Body:
Sellers have been strong, and the bearish trend is likely to continue.
Small Body (Spinning Top or Small Body):
Market indecision; usually seen before or after a correction or a price breakout.
How to Use the Body for Decision Making:
Consecutive long bodies in one direction indicate trend momentum; however, always wait for “confirmation” (such as the next candlestick or a support/resistance level).
Shadows and Market Psychology
Long Upper Shadow:
The market has moved up to a high, but sellers have pushed the price down; a sign of supply in that area.
Long Lower Shadow:
The market has tested the low, and buyers have stepped in; a sign of demand and a potential reversal.
Long Shadows on Both Sides:
Strong volatility within the interval and a balance of forces; the best approach is to wait for the candlestick to close or refer to a higher timeframe.
The Position of the Candlestick Within the Overall Market Trend (Context Matters)
A candlestick should always be interpreted within the context of the trend:
In an uptrend, weaker reversal candles are more likely to signal continuation rather than a true reversal. For example, a Doji or a Hammer forming in the middle of an uptrend may indicate nothing more than a short term correction.
Candles gain clearer meaning at key levels, such as support and resistance zones. A bullish engulfing pattern formed near a support level carries far more credibility than the same pattern appearing in the middle of a trend.
Multi timeframe analysis: Always evaluate lower timeframe candles within the structure of the higher timeframe. If the higher timeframe is trending in the opposite direction, signals from the lower timeframe become less reliable.
Quick Checklist for Reading Candlesticks Before Entering a Trade
- On which timeframe has the candlestick formed, and what does the higher timeframe indicate?
- Is the pattern forming near a key support or resistance level?
- Does the candlestick have confirmation (the next candle or volume)?
- Is the risk to reward ratio reasonable?
- Are there any major news events or economic releases occurring? If yes, exercise additional caution.
Types of Candlestick Patterns in Technical Analysis
Candlestick analysis helps identify patterns that may signal either trend continuation or market reversal. These patterns are generally divided into two main categories:
Reversal Patterns
Reversal patterns form when the market, after a defined trend, begins to show signs of weakening in its previous direction. In such cases, a series of candles appear that reflect a shift in strength between buyers and sellers.
Bullish reversal patterns typically emerge after a downtrend and signal a potential upward reversal. Well known examples include the Hammer, Bullish Engulfing, and Morning Star patterns.
In contrast, bearish reversal patterns form after an uptrend and increase the likelihood of price moving downward. Examples include the Shooting Star, Bearish Engulfing, and Evening Star patterns.
The main function of these patterns is to indicate a change in market sentiment where buying and selling pressures shift from one side to the other.
Continuation Patterns
Continuation patterns indicate that the current trend has sufficient strength to keep moving in the same direction. These patterns generally appear after a strong price movement, during which the market pauses briefly before resuming its original path.
The most important continuation patterns include Three White Soldiers, Three Black Crows, Rising and Falling Three Methods, and certain types of Doji formations.
These patterns help traders identify low risk opportunities in the direction of the prevailing trend, without needing to guess the formation of a new trend.
Key Reversal Patterns in Candlestick Analysis
Reversal patterns indicate a potential change in trend direction. These patterns appear at the end of uptrends or downtrends and can provide strong signals for trade entries or exits.
Single Candlestick Patterns
Single candlestick patterns can be identified by observing just one candle, and they often provide valuable information about immediate buying or selling pressure. These patterns may signal either a reversal or continuation of the trend, and due to their simplicity, they are considered one of the fundamental tools in candlestick analysis.
Hammer
The Hammer appears at the end of a downtrend and signals a possible bullish reversal. This candlestick has a small body at the top and a long lower shadow, indicating that sellers initially controlled the market, but buyers eventually pushed the price higher. If the following candlestick confirms this pattern, the probability of a bullish trend continuation increases.
Hanging Man
The Hanging Man looks similar to the Hammer but forms at the end of an uptrend. A long lower shadow suggests strong selling pressure, which might trigger a bearish reversal. If the next candlestick is bearish, the pattern is confirmed, signaling potential price decline.
Shooting Star
A Shooting Star is a bearish reversal pattern that forms at the end of an uptrend. This candlestick has a small body near the bottom and a long upper shadow, indicating that prices initially moved higher but sellers eventually took control. A confirmation with a strong bearish candle can indicate the beginning of a downtrend.
Two Candlestick Patterns
Two candlestick patterns form when the relationship between two adjacent candles conveys a clear indication of shifting strength between buyers and sellers. These patterns often provide clearer signals compared to single candlestick patterns and can mark the beginning of a trend reversal or the continuation of the existing movement.
Bullish Engulfing
The Bullish Engulfing pattern appears at the end of a downtrend and consists of two candlesticks. The first candlestick is small and bearish, while the second candlestick is large and bullish, completely engulfing the first one. This formation signals increasing buying pressure and a possible trend reversal to the upside.
Bearish Engulfing
Unlike the Bullish Engulfing, the Bearish Engulfing pattern forms at the end of an uptrend. It consists of a small bullish candlestick followed by a larger bearish candlestick that fully engulfs the previous one. This indicates that sellers have taken control, increasing the probability of a bearish trend reversal.
Three Candlestick Patterns
Three candlestick patterns have a more complex structure and are formed from the combination of three consecutive candles. These patterns are often considered some of the most reliable signals for trend reversals or trend continuation, and because they emphasize multi period market behavior, they generate strong signals for many traders.
Morning Star
The Morning Star forms at the end of a downtrend and indicates a reversal toward an uptrend. It consists of three candles: a strong bearish candle as the first candle, a small candle as the second one (reflecting market indecision), and a large bullish candle as the third. This formation demonstrates increasing buyer strength and a shift in market direction to the upside.
Evening Star
The Evening Star pattern forms at the end of an uptrend and signals a reversal toward a downtrend. This pattern includes a strong bullish candle as the first candle, a small candle as the second one (representing market indecision), and a large bearish candle as the third. The third candle, which closes with strong bearish momentum, indicates seller dominance and the likelihood of a downward trend developing.
The Most Important Continuation Patterns in Candlestick Analysis
Continuation patterns help traders identify whether the market will resume its main trend after a brief pause.
Marubozu
A Marubozu candle indicates strong buying pressure (in a bullish Marubozu) or strong selling pressure (in a bearish Marubozu). This candle has no shadows, meaning the price moved in a single direction from the opening to the closing. A bullish Marubozu is a sign of buyer strength and continuation of the uptrend, while a bearish Marubozu indicates seller dominance and continuation of the downtrend.
Doji
A Doji candle forms when the opening and closing prices are nearly equal, indicating market indecision. Depending on its position within the trend, a Doji may be interpreted as a signal of continuation or a potential trend reversal. If it appears within a strong uptrend or downtrend, it may suggest weakening momentum.
Three White Soldiers
This pattern consists of three consecutive bullish candles with long bodies and signals a reversal from a downtrend to an uptrend. The candles typically form without long shadows, which reflects strong confidence among buyers.
Three Black Crows
This pattern is the opposite of the Three White Soldiers and consists of three consecutive bearish candles with long bodies. It signals the beginning of a strong downtrend following an upward move. The candles usually close with short shadows, indicating complete control of the market by sellers.
How to Use Candlesticks in a Trading Strategy?
Candlesticks are not just tools for displaying price; they help traders gain a deeper understanding of market structure and make more accurate decisions. Using candlesticks within a trading strategy means combining the shape and position of the candles with the trend, key levels, and different timeframes in order to identify logical entry and exit points. In this section, we examine how candlestick patterns can be applied within a coherent system, how to utilize strong signals, and how to build a reliable strategy through proper risk management.
Combining Candlestick Analysis with Support and Resistance Levels
One of the best ways to use candlesticks is to combine them with support and resistance levels. These levels represent areas where the price has reacted in the past. If a reversal pattern such as a Hammer or a Bullish Engulfing forms near a support level, the likelihood of a trend reversal increases. Conversely, if a bearish pattern like a Shooting Star or a Bearish Engulfing forms near a resistance level, it can indicate a potential price decline.
Using Candlesticks Alongside Technical Indicators Such as RSI and Moving Averages
Candlestick analysis becomes more powerful when combined with other technical tools such as RSI and Moving Averages:
RSI (Relative Strength Index):
This indicator can show whether the market is in an overbought or oversold condition. If a bullish reversal candlestick appears near the 30 level (oversold zone), the probability of a trend reversal increases.
Moving Average:
Candlesticks forming near a moving average can provide important trading signals. For example, if the price touches the 50 period moving average and a Hammer pattern forms, it may serve as a signal to enter a buy trade.
Combining these tools with candlestick analysis helps traders receive more reliable entry and exit signals and avoid common technical analysis mistakes.
If you want to put your candlestick analysis and price action skills into practice within a professional and low risk environment, entering the world of prop trading is the best choice. FeneFx provides high capital trading accounts, transparent conditions, and professional support, allowing you to apply candlestick based strategies in real market conditions without risking your own personal capital and earn in dollars. If you are looking for a faster start and want to take advantage of market opportunities, begin your evaluation right now through buying a prop account and start your journey toward professional trading
Advantages and Disadvantages of Candlestick Analysis in Forex
Although candlestick analysis is one of the most popular price action methods in the Forex market, it has its own strengths and limitations just like any other analytical tool. Candlesticks provide important information about market sentiment and the behavior of buyers and sellers, but they should not be the sole basis for decision making. In this section, we briefly examine why candlestick analysis can be highly effective in Forex and under what conditions it may generate misleading signals. The goal is to help traders understand when to rely on candlesticks and when it is better to use complementary tools.
Advantages of Candlestick Analysis
- Clear display of market sentiment: Candlesticks show whether buyers or sellers are in control of the market and help traders identify trend strength.
- Ability to quickly identify entry and exit points: Candlestick patterns, when combined with support and resistance levels, can highlight the best entry and exit points.
- Easy integration with other technical tools: Candlestick analysis can be easily combined with indicators such as RSI, Moving Averages, and MACD to improve the accuracy of analysis.
- Flexibility across different timeframes: Traders can use candlesticks on lower timeframes for scalping and on higher timeframes for analyzing the overall trend.
Limitations of Candlestick Analysis
- Possibility of false signals: Some candlestick patterns can be misleading, especially when used on lower timeframes. To reduce this risk, it is better to use additional confirmations such as trading volume or indicators.
- Lack of long term perspective: Candlesticks typically reflect short term movements, and for long term analysis, they should be combined with other tools.
- Dependence on market conditions: Some candlestick patterns work well in trending markets but may be less reliable in range bound or sideways markets. It is essential to examine the overall market structure before relying solely on candlesticks.
- Uncertainty in volatile markets: When major economic news is released, candlesticks can generate conflicting signals. In such cases, combining candlestick analysis with fundamental analysis can be useful.
The Most Common Mistakes Traders Make in Candlestick Analysis
Many traders believe that simply recognizing the visual appearance of candlestick patterns is enough for success. In practice, however, a large portion of trading errors stems from misinterpreting these patterns. Mistakes such as ignoring the main trend, entering trades without confirmation, using candlesticks during volatile periods, or neglecting the risk to reward ratio can cause even valid patterns to fail. In this section, we examine the most common mistakes so that traders can avoid repeating them and improve their candlestick analysis skills.
Ignoring Higher Timeframes
One of the most common mistakes is that traders focus only on small timeframes, such as 1 minute or 5 minute charts, and neglect higher timeframes. Analyzing higher timeframes (e.g., 1 hour or 4 hour charts) can provide a clearer picture of the overall market trend. If a candlestick signal appears on a small timeframe but contradicts the higher timeframe, the likelihood of a failed trade increases.
Overreliance on Candlesticks Without Other Confirmations
Some traders trade solely based on a single candlestick pattern without considering other factors such as trading volume, indicators, or key support and resistance levels. This approach can lead to false signals. The best practice is to use candlestick analysis in combination with other technical analysis tools to increase the reliability of trading signals.
Conclusion
Candlestick analysis is one of the most fundamental skills for any Forex trader because it helps read market structure and trader behavior directly from price charts, without relying on complex indicators. Proper understanding of candlestick patterns, combined with the trend, key levels, and complementary tools, can lead to more precise entry and exit points and more reliable risk management. However, no single pattern is sufficient on its own, and success in candlestick analysis comes from patience, practice, and multidimensional analysis, ultimately leading the trader to a logical and professional approach.
Frequently Asked Questions
Are candlestick patterns alone sufficient to enter a trade?
No, they should always be confirmed with the trend, key levels, or indicators.
What is the best timeframe to use candlestick patterns?
Higher timeframes, such as 1 hour and 4 hour charts, provide more reliable signals.
Can candlestick patterns be used in all markets?
Yes, they are applicable in all supply and demand based markets, such as Forex, stocks, and crypto.
How can we determine if a candlestick pattern is valid?
The pattern is more reliable when it appears in the direction of the trend, at a key level, and with confirmation from another candle.
Comments
Never understood what the wicks actually represented until this article. The buyer/seller pressure explanation made it click. Appreciate it.
Spent my first six months memorizing every pattern name and still lost money. It only clicked when I started reading candles together with support/resistance instead of in isolation.
Could you do a follow-up on multi-candle patterns like engulfing and morning star? Single candles make sense now but the combinations still confuse me.
Really well structured, the visuals helped a lot.
Good overview, but I'd caution beginners against pattern-hunting on low timeframes. A hammer at a weekly support level means something; the same candle in the middle of 5-minute chop is just noise.